Download
1 / 21
220 likes | 387 Vues
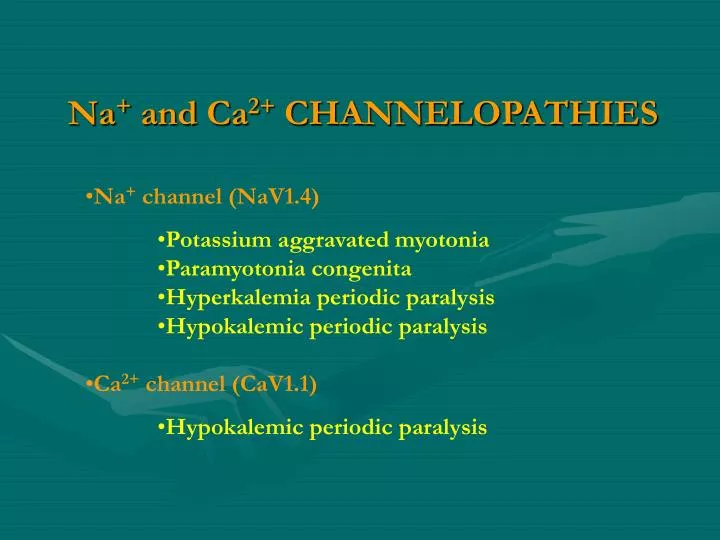
Na + and Ca 2+ CHANNELOPATHIES. Na + channel (NaV1.4) Potassium aggravated myotonia Paramyotonia congenita Hyperkalemia periodic paralysis Hypokalemic periodic paralysis Ca 2+ channel (CaV1.1) Hypokalemic periodic paralysis. CHANNELOPATHIES IN SKELETAL MUSCLE. Na + CHANNELOPATHIES.

E N D
Na+ and Ca2+ CHANNELOPATHIES • Na+ channel (NaV1.4) • Potassium aggravated myotonia • Paramyotonia congenita • Hyperkalemia periodic paralysis • Hypokalemic periodic paralysis • Ca2+ channel (CaV1.1) • Hypokalemic periodic paralysis
Na+ CHANNELOPATHIES * * From Hayward et al. 1999. Neurology 52:1447
TEST PULSE +80 mV -120 mV -80 mV ACTIVATION & FAST INACTIVATION VOLTAGE DEPENDENCE ACTIVATION INACTIVATION
PMC PAM
PMC PAM
PMC PAM
PMC PAM
PAM G1306E
PMC PAM
Figure 1. Recovery from inactivation is hastened for I693T channels. Tracings show superimposed Na currents recorded from human embryonic kidney cells expressing wild-type (WT) or I693T channels after variable durations of recovery from inactivation. Channels were inactivated by a 30-second conditioning pulse to -10 mV and allowed to recover at -100 mV for 0.03 to 10 seconds. Extent of recovery was measured by comparing the peak Na current elicited by a subsequent test depolarization (-10 mV) to that elicited by a control depolarization (-10 mV, no preceding conditioning pulse): 8.9 nA for WT, 6.8 nA for I693T (dashed lines). Residual capacitance transients have been blanked.
PMC PAM HEPP Figure 2. Slow inactivation is impaired by mutations associated with periodic paralysis (T704M, M1592V) or cold-induced weakness (I693T). The kinetics of recovery from inactivation following 30-ms or 30-second conditioning pulses to -10 mV for wild-type (WT) and mutant channels are shown. Relative current is the amplitude of the peak Na current elicited after the recovery period, divided by the maximal peak Na current measured at the start of the conditioning pulse. The dashed line shows a time constant of ~7 ms for recovery from fast inactivation for WT channels. The V1589M and A1156T channels exhibited accelerated recovery from fast inactivation (data for 30-ms conditioning pulses, left) but normal slow inactivation (SI) (data for 30-second pulses, right). The I693T, T704M, and M1592V channels had normal recovery from fast inactivation but accelerated recovery from SI, implying destabilization of the slow-inactivated state. After each trial employing 30-second pulses, the potential was held at -100 mV for 60 seconds to allow complete recovery from SI. Shown are mean ± standard error of the mean for n = 7 to 9 cells for WT and each mutant for 30-ms conditioning pulses, n = 4 to 5 cells for 30-second conditioning pulses. Open symbols depict mutations for which paralytic weakness is a prominent clinical finding.
PMC PAM HEPP Figure 3. Steady-state voltage dependence of slow inactivation (SI) is altered by I693T, T704M, and M1592V mutations. Each conditioning potential was maintained for 60 seconds. Cells were then repolarized to -100 mV for 20 ms to allow recovery from fast inactivation. The extent of SI was measured as the reduction in peak Na current, relative to the response elicited from a holding potential of -100 mV. At potentials positive to -60 mV, the extent of SI was reduced for I693T, T704M, and M1592V channels. Shown are mean ± standard error of the mean for n = 5 cells each. Open symbols depict mutations for which paralytic weakness is a prominent clinical finding.
Figure 4. The rate of onset for slow inactivation (SI) at a conditioning voltage of -30 mV is similar for wild-type and mutant channels, but the extent of SI is reduced for I693T, T704M, and M1592V. The duration of the -30 mV conditioning pulse was varied from 20 ms to 60 seconds. Peak currents were elicited at -10 mV following a hyperpolarizing pulse to -100 mV for 20 ms to allow recovery of fast-inactivated channels. Shown are mean relative peak currents ± standard error of the mean for n = 5 cells each. Open symbols depict mutations for which paralytic weakness is a prominent clinical finding.