Download
1 / 14
140 likes | 258 Vues
1. POPULATION IN TRANSITION. IBDP Expectations: Population Change:

E N D
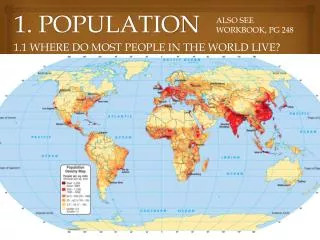
1. POPULATION IN TRANSITION • IBDP Expectations: • Population Change: • Explain population trends and patterns in births (Crude Birth Rate), natural increase and mortality (Crude Death Rate, infant and child mortality rates), fertility and life expectancy in contrasting regions of the world. Analyse population pyramids. Explain population momentum and its impact on population projections.
Total Fertility Rate The average number of children born to a woman during her lifetime. • Number of live births per female of reproductive age (15-49). • Numbers such as 2.2, 4.5. • Indicates population change over a long period of time. • Instructive about societal norms in any given culture. • A TFR of 2.1 is considered as being the replacement birth rate. • Lower than 2.1 yields population decrease while rates greater than 2.1 yields population increase. • Improvements in medical conditions lower the replacement rate (below 2.06 in many countries).
Crude Birth Rate Total Fertility Rate 25 males of any age 25 females between 15-49 25 females of any age 10 children born that year 10 children born that year 1,000 1,000 60 30 TFR = 2.04 = (60/1,000) * (49-15) CBR = 30
Total Fertility Rate, 1994-2000 What is the trend? Replacement rate (2.1)
Factors Affecting Fertility Rate Biological Determinants Social- Cultural Determinants Fertility Economic Determinants
Biological Determinants • Biological determinants • Age: • Reproductive age of women ranges from 15-44 or from 15-49. • Men: 13-?? • Health and nutrition: • Poor health and/or nutrition can reduce fertility. • Linked with underweight children. • Linked with child mortality rates. • Environment: • Represents an undocumented impacts on fertility. • Stressed populations tend to have less males than females. • Possible correlation between sperm count and pollution.
Social Determinants • Social determinants • The social norms and acceptance of practices affecting fertility. • Differ from society to society. • Marriage: • Particularly the average age of marriage. • The percentage of people never married varies spatially and affects fertility rates. • Late marriage age generally involves less children. • Contraception: • Used by 30-50% of all married couples. • Availability of contraceptive devices and social attitudes toward their use affect fertility rates. • Sharp differences exist between MEDCs and LEDCs. • Some notable exceptions, such as China and Cuba.
Social Determinants (Continued) • Abortion: • Last resort measure when contraception failed (or was not used). • Its legality is not universal and under challenge in some countries where it is permitted. • Global figures (1999): • 210 million pregnancies. • 22% of all pregnancies end up in a abortion. • 46.2 million abortions, of which 20 million procedures are obtained illegally. • Illegal abortions are common in most societies, even where it is prohibited. • Culture plays an important determining role in the impact of abortion. • United States: 49% all pregnancies unwanted and about half of unwanted pregnancies ended in abortion (1.4 million abortions per year).
Economic Determinants • The role of children, or their “value” affects fertility. • Inverse relationships: • Fertility and income per capita. • Fertility and urbanization. • Traditional rural societies: • Children still play an important economic role and contribute to family wealth, • Fertility is likely to remain higher. • Industrial and post-industrial societies: • Costs tend to increase with the development level of the society. Deflate the fertility rate since parents must consider the direct and opportunity costs of bearing additional children.
Factors Affecting Fertility Rate • Status of Women • Level of education • Employment opportunities • Type of residence • Religion of parents • Level of available health care • Machismo • Perceived cost of having children • Pressure from the government
World Fertility RateStrongly correlated with level of economic development Spatial distribution Fertility