Download

1 / 37
370 likes | 658 Vues
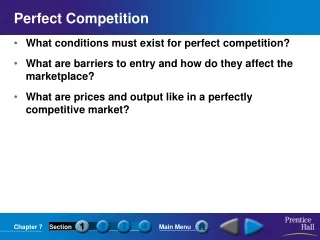
Assumptions of perfect competition. 1- Homogeneous product 2- consumers are identical from seller ’ s point of view 3- Both firms and consumers are numerous. 4- Both firms and consumers have perfect information about the market. 5- Entry and exit are free without any serious barrier

E N D
Assumptions of perfect competition 1- Homogeneous product 2- consumers are identical from seller’s point of view 3- Both firms and consumers are numerous. 4- Both firms and consumers have perfect information about the market. 5- Entry and exit are free without any serious barrier Violation of any of the above assumption will lead to emergence of monopoly. For example ; By assumption 1 we do not have trademarks or patents , special brand , so on. The entrepreneurs will sell to the highest bid. By assumption 3 ,neither the change in the production level of individual firms, nor a change in the consumption level of individual consumer could affect the price level. Consumers and producers are price takers. This is the most important feature of perfect competition conditions. Any level of market power to influence the price level is not accepted by this condition. Market Equilbrium
Assumptions of perfect competition By assumption 4 , a singleprice must prevail in the market. Having more than one price for a single commodity with the same quality is not accepted. So in such a situation; Consumers are maximizing their utility given the income level and commodity prices. Producers are maximizing profit , given the cost of production and input prices. Consumers are demanding in the commodity market and supplying their inputs in the factor market. While producers are demanding inputs in the factor markets and supplying in the commodity market. Neither any consumer , nor any individual could affect the price level. But the action of all of the consumers or all of the producers could affect the market price level . Market Equilbrium
Individual demand of each consumer Mci ≥p0 individual supply of each firm Assumptions of perfect competition P D=Σjdj S=ΣjMCi dj =f(pj,mj) MCi ACi Market supply Market demand MR=P In the following figure , we could see the function of a perfectly competitive market. P0 P0 Q qj qi qi0 Q0 qj0 Demand for each firm’s product Q0=Σiqi0 =Σjqj0 Supply which each individual faces Market clears because of working the market mechanism (invisible hand) Market Equilbrium
Production periods (perfect competition) We can specify production periods into three categories; very short-run , short-run , long-run. Demand function of individuals in any of these categories is downward sloping and is a function of it’s own price, other prices and income level. But the shape and nature of the supply function differs concerning the length of the period. 1-very short-run Supply can not be increased or decreased. All the supply should be sold out any how. Like the fisher man who should sell all the fishes by the end of the day. Or the winter cloth which should be sold by the end of the winter. Or the annually wheat production which should be sold by the end of the year, because it should not be stored. Because of competition, Increase or decrease in demand will be followed by increase(decrease) in price level . Price is a demand Price and supply does not have any Role in price determination. Very short-run supply S=MC P* D D’ P1* Market Equilbrium
Production periods (perfect competition) P , C 2- Short-run In short-run supply can be changed, but scale of production can not. At least ,one of the inputs(capital) is fixed and this will limit the change in production level. SMCi SAVCi Si=SMCi(p) P≥min SAVC Si=0 P<min SAVC Market supply=S=Σisi(p) Pm=Min AVC qi qm Market Equilbrium
Production periods (perfect competition) 3- Long-run In long-run all the inputs can change . So scale of production can vary and be adjusted to an optimum level. The long-run marginal cost of a firm is it’s long-run supply , but the long-run supply of industry is not the summation of the firm’s individual marginal cost curve . The Shape of industry long-run supply curve depends upon the presence of the external economies ordiseconomies. When there are new entry into the industry , the production level in the industry will increase, Qindustry When Qindustry Pinput external diseconomies Pinput external economies 1- External diseconomies; Dinputs Pinputs Tci Mci Poutput 2- External economies; sometimes when production in industry level increases , better trained and more efficient use of labor is economical and possible . For this reason Market Equilbrium
Production periods (perfect competition) Total cost of production for producing a specific amount of output will decrease. This will lead to decrease in the marginal cost of production and decrease in price of output. Taking in to account the externalities , solving the following equations will give the market supply equation; Q=Σinqi Ci = Φ(qi,Q) Πi = TRi– TCi i = 1,2,3…n dΠi/dqi = p - dΦ(qi,Q)/dqi = 0 n equations , n unknowns , qi=si(p)=individual supply Market supply = SM(p)=Σin si(p) d SM(p)/dp >0 external diseconomies (min of LAC shifts up) d SM(p)/dp <0 external economies (min of LAC shifts down) d SM(p)/dp =0 No externality (min of LAC stays at the previous price level) Market Equilbrium
Commodity market equilibrium(perfect competition) 1- Short-run equilibrium; In a perfectly competitive situation, the action of auctioneer and contracting and re-contracting process , equilibrium will be attained. When there is excess demand, (D>S), biding up the price level by consumers will force the price level to increase. Increase in price level will encourage the sellers to increase their supply of product to the market. This process will continue till excess demand disappears and market clears. When there is excess supply , (S>D), sellers are competing to sell their products to the limited customers, so they try to reduce their price level to get a bigger share of the market. Reducing the price will force them to supply less amount of product to the market. This process will continue till excess supply disappears and market clears. At the equilibrium price level , neither the seller nor the buyer is willing to recontract any further. Market Equilbrium
Commodity market equilibrium(perfect competition) P LS 2- long run equilibrium; Intersection of long-run supply curve with the corresponding demand curve forms the long-run equilibrium. long-run cost includes normal profit. Normal profit is minimum necessary for the firm to remain in existence. In other words total revenue is enough for managerial services , risk bearing , organizational provision, etc. If Pe is such that industry earns more than Normal profit , firms will enter to industry, Supply shifts to the right, pe will decrease, Excess profit will disappear. S(P)=nSi(P) D(p)=S(P) Πi=Tri– LTCi =0 PSi(P) – Φ[Si(p)]=0 qi=Si(P)=S(P)/n Solving the above equations in long run will give number of firms and equilibrium demand, supply, and price level. Pe D Q Qe Market Equilbrium
S=S(P) P LMCi 1 S’=S’(P) Commodity market equilibrium(perfect competition) P’ 2 LACi Excess profit 1 2 Pe LS Pe We could see the Long run equilibrium in the following figure. D’=D’(P) D=D(P) qi qi0 qi’ Q0 =Σin qi0 Q1 =Σin’qi0 n’>n Constant cost industry with no externality Market Equilbrium
Commodity market equilibrium(perfect competition) Differential cost condition and rent; The symmetric assumption of the firms makes the analyses convenient , but it may not be necessary in the Long-run. Firms may differ with respect to the plant size, scare factor, organization ability, etc. If one firm or a group of firms could produce with lower cost such as those shown in Figure a . The earned profit in this way could be interpreted as the rent of the factors of production or input which is causing the cost of production to decrease. This rent (or excess profit) could be claimed by the said factor as increase in its wage in the log-run. MC1 P P P MC2 AC1 S AC2 pe pe pe Rent=excess(pure) profit D q1 q2 Q=q1+q2 Market Equilbrium
Commodity market equilibrium(perfect competition) An application to taxation; Ci=Φ(qi)+bi Tax rate = t per unit of production (sale) Ci= Φ(qi)+bi + tqi MCi= Φ’(qi)+ t MCi = P , Φ’(qi)+ t =P , qsi=qsi(p – t) = individual supply of the firm S=Σin qsi(p – t) = Qs(P – t) = market supply By imposing the tax, supply shifts to left; If t=vp , Ci= Φ(qi)+bi + vpqi MCi= Φ’(qi)+ vp MCi = P , Φ’(qi)+ vp =P, qsi=qsi [p(1-v)] S=Σin qsi [p(1-v)] = Qs [P(1-v)] S=Qs(p – t ) S=Qs(p) P c Pe Tax rate b a qe Market Equilbrium
Commodity market equilibrium(perfect competition) An application to taxation; Suppose that ; Ci=0.1qi2 +qi +10 MCi = 0.2 q +1 , MCi= P , qsi= 5p-5 if p≥min avc(=1) and qsi=0 if p<1 If n=100, market supply=S=Σin qis = 500p – 500 , if p≥1 and S=0 if p<1 If D=4000 – 400 p , D=S , 4000 – 400 p = 500p – 500 , then pe=5 , qe=2000 If t=tax rate = t per unit of output, Ci=0.1qi2 +(1+t)qi +10 MCi = 0.2 q+1+t , MCi= P, qsi= 5(p-t)-5 if p≥min avc(=1+t) and qsi=0 if p<1+t If n=100, market supply=S=Σin qis = 500(p-t) – 500 , if p≥1+t and S=0 if p<1+t D=4000 – 400 p = S= 500(p-t) – 500 pe=5 + (5/9)t (5/9)t = consumer burden=increase in the market price =bc t - (5/9)t = (4/9)t = producer burden = decrease in price received by producer=ab Market Equilbrium
Factor Market Equilibrium Perfectly competitive factor market; The Factor is homogeneous, Buyers and sellers are numerous Buyers and sellers does have perfect information Free exit and entry is available into and from the market. Demand function for inputs could be derived from the production function on the assumption of profit maximization. That is ; price of input (Pi)= value of marginal product of input i (VMPi), but derivation of supply function for input depends whether the input is primary or produced input. If the input is a produced one, supply could be derived from the marginal cost by equating it to price level. If input is a primary one , the specific procedure should be defined. For example the utility maximization approach could be used to derive the labor supply, which is called the labor-leisure choice model , or the time allocation model Market Equilbrium
Factor Market Equilibrium labor-leisure choice model; W + H = T (T=24) W= working time , H=leisure time U = g(H , Y )= U[(T-W) ,Y] Y = labor income = Wr Wr + Hr = Tr r= wage rate per hour Max U= g(H , Y ) S.T. Y + Hr = Tr U*= g(H , Y ) + λ [Tr-(Y + Hr)] ∂U*/∂H = 0 H=H(r ) W=W(r) supply function ∂U*/∂Y =0 ∂U*/∂λ =0 As it is found from the supply function, working time is a function of wage rate. As it is expected the supply function has positive slope, but in some special case it has negative slope. In order to find out the reason we have to analyze the substitution and income effects of change in the wage rate. Market Equilbrium
Downward sloping supply curve (HH2 < H2H1) Y=Wr Wr + Hr = Tr Factor Market Equilibrium Upward sloping supply curve (HH2 > H2H1) (24-H1)r1 = Y1 Substitution and income effect of change in wage rate , r , H=T=24, w=0 Y=0 H=0 , W=T=24 Y=24r U1 U (24-H)r=Y r1 H r H2 H1 H H2H1=income effect(increase in income, increase in leisure) r1> r HH1=total effect ,(increase in wage, decrease in leisure, increase in working time) HH2 =substitution effect (increase in wage, decrease in leisure) Market Equilbrium
The Existence and Stability of Equilibrium P P P S S D S D 1-Existence; Demand and supply curve should have at least one point in common. Three situation in which the supply and demand curves have no point in common are pictured as following; D q q q Free goods Even if P=0, S>D Solid gold school lunch box Even if q=0 , Psupply>Pdemand , What producers are willing to receive is always greater than what consumers are willing to pay. mis-specification error Market Equilbrium
The Existence and Stability of Equilibrium P P P D S B FIG 1 FIG 2 D FIG 3 S E p1 C p2 Uniqueness; Most of the time it is possible for more than one equilibrium to exist. Backward bending supply curve is an example. Uniqueness condition; 1-[D’(p) – S’(p)]= δ <0 around the equilibrium price (p0) 2- if at P0, δ <0 , then ; at any P> P0 ,D<S , and at at any P < P0 ,D>S . None of the above figures satisfies the two conditions for unique equilibrium. So we will have multiple equilibrium price levels. Ignoring the equilibrium points at which δ=0, the sign of δ must alternate in multiple equilibrium price. At point A in figure 1 , δ is negative. But at point B , δ is positive. The same is true for figure 2 .Point C in figure 2 is semi-equilibrium point. In figure 3 we will have a range of equilibrium points. A B D S A q q q Market Equilbrium
The Existence and Stability of Equilibrium 2- The Stability of Equilibrium Existence of an equilibrium does not guarantee that it will be attained. There is no reason to assume that the initial price will happen to be the equilibrium price. Stable equilibrium ; disturbance result in a return to equilibrium. Unstable equilibrium ; disturbance does not result in a return to equilibrium. Static stability ; Static analysis abstract from the time path of the adjustment process and considers only the nature of the change. We will work with the Walrasianstability condition which price level is considered as a means of adjustment. E(P) = D(P) – S(P) dE(P)/dp = E’(P)= D’(P) – S’(P)<0 If S(P) & D(P) are both positively sloped, supply should be flatter than demand. If S(P) & D(P) are both negatively sloped, demand should be flatter than supply. Point A in FIG 1 and 2 is stable since E’(P) is negative. Point B in Figure 1 and 2 is not stable, since E’(P) is positive in point B . Point C is semi-stable . These conditions are not enough for determining about the dynamic stability of the point. Market Equilbrium
The Existence and Stability of Equilibrium Dynamic stability; Suppose that , we proved the existence of equilibrium and found out that it will finally be attained. But , one might not expect instantaneous adjustments in the present model. The dynamic nature of the re-contracting may be formulized in a model in which re-contracting takes place during periods of fixed length, with the auctioneer announcing the new prices at the beginning of each period. Equilibrium is stable if prices converge to the equilibrium over time. Suppose that positive excess demand would raise the price level over time according to the following relation. Pt– Pt-1 = k E(Pt-1) k>0 , E(Pt-1)= excess demand in period t-1 Suppose ; Dt=aPt+ b St=Apt + B (Pt– Pt-1)/k = E(Pt-1) = (a – A)Pt-1 + b – B Pt= [1+k(a – A)]Pt-1 + k (b – B) first order difference equation solving the equation will give the following solution; Market Equilbrium
The Existence and Stability of Equilibrium Pt=(Po– Pe)[1+k(a – A)]t + Pe Po = initial price at t=to Pe=(b-B)/(A-a) = equilibrium price when Dt=St for stability condition Pt should converge to Pe over time. That is ; if , 0<[1+k(a – A)]<1 , when t converges to infinity, Pt converges to Pe without oscillation. [1+k(a – A)]<1 , k(a – A)<0 , k>0 , (a – A)<0 , static stability condition, 0<[1+k(a – A)] , -1 <k(a – A) , k>-1/(a-A) , k>1/(A-a) As it could be seen from the above formula, for maintaining the dynamic stability condition ,not only the static stability condition should be maintained but also the magnitude of k should be greater than some minimum amount. In other words the dynamic stability condition dependson k which indicates that the extent to which the market adjust. As it is clear, the dynamic stability condition implies the static condition , but the reverse is not true. Market Equilbrium
The Existence and Stability of Equilibrium Pt Pt=Pt-1 In the following figures we could show that how the magnitude of k influence the length of adjustment. Pt=Pt-1=Pe Pt=Pt-1 + k E(Pt-1) P3 P2 P1 Larger K will lead to increase the speed of adjustment and fewer periods of adjustment. Pt-1 Po P1 P2 Market Equilbrium
The Existence and Stability of Equilibrium Dynamic Stability with Continuous Adjustment Adjustment may take place continuously rather than in discrete time intervals. The condition for dynamic stability becomes; ( dp/dt )= k E(P) E(P)t=Dt – St= (aPt+b) – (Apt + B) dp/dt = k(a – A)pt +k(b – B) first order differential equation solution : Pt=(Po– Pe)ek(a-A)t + pe If (a – A)<0 , P tends to Pe when t tends to infinity Local Stability ; An equilibrium point is locally stable if the system returns to it , given a small initial deviation from the equilibrium. Global Stability; An equilibrium is global stable if system returns to it for any initial deviation from equilibrium.Linear models are both locally and globally stable if they are stable. In order to make models globally stable,linear approximation is used for non-linear models. Market Equilbrium
Dynamic Equilibrium with lagged adjustment Production takes time, so adjustment may not be instantaneous. In some markets like Agricultural products, supply responds to last year price level , while demand respond to the current year price level. Dt=aPt + b St=Apt-1 + B equilibrium price = Pe=(B – b)/(a – A), where Dt=St ,(Pt=Pt-1=Pe) As St appears in the market , Pt makes it equal to Dt. In equilibrium no producers is left with unsold stocks, and no consumers left with unsatisfied demand. Dt =St aPt + b – Apt-1 – B =0 Pt= (A/a)Pt-1 + (B – b)/a Pt=(P0– Pe)(A/a)t + Pe Dynamic stability condition; Pt tends to Pe when t tends to infinity. |A/a| < 1 or |1/a| (slope of demand) < |1/A| ( slope of supply ) If |A/a| < 1 and the slope of demand and supply have opposite sign price will oscillate and the oscillation will decrease in amplitude and it is dynamically stable ( Fig a). If |A/a| > 1 the oscillation will increase in amplitude and it is not stable (Fig b). If |A/a| < 1 and the slope of demand and supply have same sign ,price will not oscillate and it is dynamically stable (FIG c) Market Equilbrium
Dynamic Equilibrium with lagged adjustment P S S D 1- when demand and supply have different sign in slopes; Po S Po P2 Po P1 P1 D D P1 q qo q2 q1 q2 qo q1 qo q1 FIG A FIG B FIG C Excess demand is zero in this COBB-WEB model. Market Equilbrium
Future Markets Buyers and sellers agree to transact at a specified price at a future date. In agricultural commodity markets, risk-averse farmer can avoid price uncertainty by selling the product in the future market. People who buy and sell for these reasons are said to hedge against price uncertainty. Such a person will participate in the future market if he can increase his expected utility by buying and selling in the Lottery offered by the market. Expectations are identical for all individuals ; every one expects p1 …pn with the probability v1…..vn. All buyers and sellers are risk-averse though not by the same degree and obey Von-Neumann Morgenstern axioms. Suppose that a farmer is producing q with the cost function C(q) which is strictly convex. The farmer has a utility function in the form of U(Π) which is strictly concave. 1- If the farmer sells in the future market at the going price P* , he maximizes utility by equating this price to marginal cost. P* = MC(q) , q=q* , U*=U[p* q* - C(q*)] , since p=f(q) , U*=V(P*) 2- if he does not sell in the future market , the first order condition for expected utility maximization is :dE[U(Π)]/dq = Σin vi U’(Πi)[Pi– C’(q)]=0 → q=q0 , U0 If U0>U*, then farmer will not sell in the future market. If U0 < U*, then farmer will sell in the future market. Suppose that at Po* ,U0 = U*, If P* > Po* , U0 < U*, then farmer will sell in the future market If P* < Po* , U0 > U*, then farmer will not sell in the future market Market Equilbrium
Risk- assumption Suppose that A denotes the asset position of an individual, with A0 denoting the initial position of the asset. U0=U(A0) is the initial level of utility for the individual. D is the excess demand in the future market. D>0 means the individual is buying for the future delivery. D<0 means the individual is selling for the future delivery. Pi is the price of asset in time t=ti . P* is the price which is agreed upon in time t=t0 . Ai is the total value of the asset in time t=ti . The individual is trying to maximize his expected utility ; max E[U(A)]=Σin vi U[Ai] S.T. Ai =A0 + (Pi– P*)D {dE[U(A)]/dD}= Σin vi U’[Ai](Pi– P*)=0 D=D* , D*=D(p*) if p* = p*0 , D(p*)=0 , then ; for p* > p*0 , D(p*)>0 he will be net buyer for the future market for p* < p*0 , D(p*)<0 he will be net seller for the future market Market Equilbrium
Problems , H & Q , CH 6 6-1 two hundred consumers derive utility from the consumption of two goods.each has the utility function U = 10 q1 + 5q2 + 1q2. Each has a fixed income of 100 dollars. Assume that the price of q2 is 4 dollars per unit. Express the aggregate demand for Q1 as a function of P1. Is the aggregate demand curve downward sloping. Solution; Max U = 10q1+5q2+q1q2 S.T. 100 = 4q2 + p1q1 L= 10q1+5q2+q1q2 + λ[100 - 4q2 + p1q1 ] ∂L/∂q1 = 10 + q2– λp1 =0 ∂L/∂q2 = 5 + q1– 4λ=0 ∂L/∂λ = 100 - 4q2 + p1q1 =0 q1= 70/p1– 2.5 Q1= 200q1 = 14000/p1– 500 dQ1/dp1 = -p12/14000 <0 6-2 construct a short-run supply function for an entrepreneur whose short run cost function is C=0.04q3 - 0.8q2 +10q1 + 5 Solution ; P=MC MC=0.12 q2– 1.6q + 10 =p Market Equilbrium
Problems , H & Q , CH 6 Min AVC = Min (TC/q)= Min(0.04q2– 0.8q +10) q=10 If q=10 , p= 0.12 q2– 1.6q + 10 =6 If p≥6 , q ≥ 10 , if P<6 , q=0 6-3 A good Q is produced using only one input x . The market for Q is supplied by 100 identical competitive firms each of which has the production function q=xb . Where 0<b<1 . Each firm behaves as if the price of x were constant. However , the industry as a whole faces an upward sloping supply curve for X as r=b(100x) where b>0. Derive the industry long-run supply curve. Solution ; r=b(100x)=b(100 q1/b) [q=xb x=q1/b ] TC=rx= b(100 q1/b) q1/b MC=P , MC=(200/b)bq(2-b)/b = P qi= [(bP)/200b]b/(2-b) S=100 qi 6-4 The long run cost function for each firm that supplies Q is C=q3– 4q2 +8q Firms will enter the industry if profits are positive and leave the industry if profits are negative. Describe the industry’s Long run supply function. Assume that the corresponding demand function is D=2000 – 100p. Determine the equilibrium price , aggregate quantity, and number of firms. Market Equilbrium
Problems , H & Q , CH 6 Solution; TC=q3-4q2+8q AVC=q2-4q+8 d( AVC)/dq=0, 2q-4=0 , qi=2 , AVC=4 Constant cost industry; p=4 →LS D=2000-100p , p=4 , D=Q=1600 Q=Σinqi , qi=2 , n=800 Market Equilbrium
Problems , H & Q , CH 6 6-5 consider an industry with n identical firms in which the ith firm’s total cost function is Ci=aqi2 `+ bqiq` (i=1,2,3,…..n) .where q=q1+q2+…..qn . Derive the industry supply function. Solution ; Πi = Tri - Ci = pqi - aqi2 -` bqiq (∂Πi/∂qi)= P – 2aqi– bq -bqi =0 qi= (p – bq)/(2a+b) q= Σin qi = Σin (p – bq)/(2a+b) = (np - b Σin q )/(2a+b) = (np – bnq )/(2a+b) q=np/(2a +nb +b) 6-6– Construct an effective supply curve for an industry which has two sources of supply:domestic production with the supply curve S=20 + 8p. And 2- an unlimited supply of imports at a fixed price of 20. Solution ; p Domestic supply Supply of imports 20 Effective supply 180 q Market Equilbrium 20
Problems , H & Q , CH 6 6-7 ;Determine equilibrium price and quantity for a market with the following demand and supply functions; D = 20 – 2p and S=40-6p. Assume that a specific tax of 1 dollar per unit is imposed. Compute the changes in price and quantity. Solution ; D =S 20 - 2p = 40 – 6p , p=5 , D = S = 10 . if tax rate =1 , then ; S = 40 – 6(p –1) D= 20 – 2p S=D , p=6.5, D=S=7 P D= 20 – 2p 6.5 6 Tax = 1 5 S = 40 – 6(p –1) S=40 – 6p q 10 20 Market Equilbrium 4 7
Problems , H & Q , CH 6 6-8; Assume fifty firms supply commodity Q at location I and fifty at location II. The cost of producing output qi for the ith firm in either location is 0.5qi2 . The cost of transporting the commodity to the market from location I is 6 dollars per unit, and location II , 10 dollars per unit. Determine the aggregate supply function. Ci = 0.5 qi2 + 6qi MCi =qi+6=p qi=p-6 , qi=0, p≤6 Cii = 0.5 qi2 + 10qi MCii =qi+10=p qi=p-10 qi=0, p≤10 S=50(p-6)+50(p-10)=100p-800 aggregate supply P P P MCII 10 MCI 10 MCI +MCII =S 6 q q q 4 4 Market Equilbrium
Problems , H & Q , CH 6 6-9 ; A consumer allocates a fixed amount of time to labor and leisure. He derives satisfaction from the time he retains as leisure, and income , y , that he secures by selling the labor at a fixed wage rate. His utility function is U=Ly + aL where a is a positive parameter. Derive the consumer’s supply function for labor. Is his labor supply curve upward sloping. T=W + L , W = T – L , Y=rW = r(T – L) r= wage rate U=LY + aL = L r (T – L )+ aL = -rL2 +(a + Tr)L dU/dL = 0 , a + Tr –2 r L = 0 L=(a+Tr)/(2r) W = T – L = T - (a+Tr)/2r = T/2 – a/(2r) dW/dr = a/2r2 >0 6-10 ; Assume that aggregate demand and supply function are given by D=25/p and S=(5p)1/2 . Is this dynamic process is locally stable. dp/dt = kE(p) Pt=(po– pe)ek(a-A)t + Pe Stability condition ; (a –A)<0 , a=-25/p2 , A=(1/2)51/2p-1/2 Market Equilbrium
Problems , H & Q , CH 6 P S 6-11 ; determine whether the equilibrium solution exist for markets with the following demand and supply function. D=12-3p , S=-10+2p, Equilibrium does not exist D=16 –2p , S = 20 – 2p slopes are the same and equal to –2 . They are parallel . Equilibrium does not exist. D = 50 – 4p , S = 10 +10p – p2 S =D , p2-4p+48=0 , (p-4)(p-10)=0 p=4 , 10 q= 34, 10 4 D q 12 Market Equilbrium
Problems , H & Q , CH 6 6-12 ; Consider the following markets which are characterized by lagged supply response : Determine the equilibrium price and quantity for each market . Assume an initial price 20 percent below the equilibrium price for each market, and determine the number of periods necessary for each price to adjust to within 1 percent of equilibrium. (a) - Dt=40 – 10 pt ; St=2+9pt-1 (b) - Dt=30 – 5 pt ; St=20 - pt-1 Solution ; Dt=apt+b St=Apt-1 + B Equilibrium ; pt = pt-1=pe , pe=(B-b)/(a-A) , p0=0.8pe pt=(p0-pe)(A/a)t + pe = (-0.2pe)(A/a)t + pe=pe[1-0.2(A/a)t] 0.99pe ≤ pt ≤ 1.01pe , Dt=40 – 10 pt ; St=2+9pt-1 , , pt=[1-0.2(-9/10)t]pe ,, pe=2 -0.05 ≤ (-0.9)t ≤ 0.05 t=29 b- Dt=30 – 5 pt ; St=20 - pt-1 (0.2)t ≤ 0.05 t=2 Market Equilbrium
Problems , H & Q , CH 6 6-13 ; A sugar refiner has a strictly concave production function for which labor (L) and raw sugar (x) cane are the only inputs. His production of refined sugar (qs) and purchase of inputs will take place next spring, but he must determine his future production level (qS) today.The future prices of refined sugar (ps) and labor are (pL) known with certainty, but the price of raw sugar will assume one of the values (r1, r2……rn) , with the respective probabilities (v1 , v2 ,…..vn). Show how you would determine his futures-market raw sugar demand. Π=psqs– C C= pLL + rix qs=qs(L , x) Πi=psqs– (pLL + xri) EU(Πi)= Σin vi U(Πi) d[ EU(Πi)]/dx =d Σin vi U(Πi)/dx = Σin vi U’(Πi)[ps ∂qs/∂x – ri]=0 Σin vi U’(Πi)( VMPx– ri )=0 Risk-neutral , U’(Πi) = α , Σin vi ( VMPx– ri )=0 , q=q0 , x=x0 Risk-averse , U’(Πi) = downward , Σin vi U’(Πi) ( VMPx– ri )=0 , VMPx should be rising, MPx is downward sloping , q<q0 Risk-lover , U’(Πi) = upward , Σin vi U’(Πi) ( VMPx– ri )=0 , VMPx should be falling, MPx is downward sloping , q > q0 Market Equilbrium