Download
1 / 12
120 likes | 253 Vues
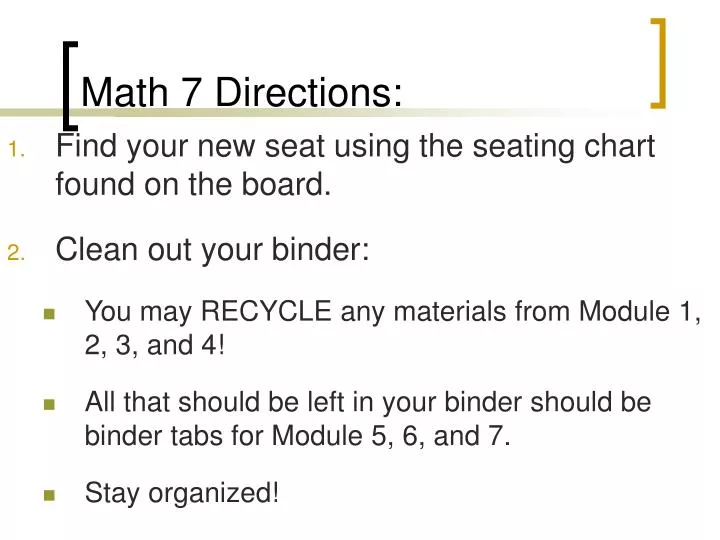
Math 7 Directions:. Find your new seat using the seating chart found on the board. Clean out your binder: You may RECYCLE any materials from Module 1, 2, 3, and 4! All that should be left in your binder should be binder tabs for Module 5, 6, and 7. Stay organized!.

E N D
Math 7 Directions: • Find your new seat using the seating chart found on the board. • Clean out your binder: • You may RECYCLE any materials from Module 1, 2, 3, and 4! • All that should be left in your binder should be binder tabs for Module 5, 6, and 7. • Stay organized!
Mean, Median, Mode and Range We are learning to…analyze how adding another piece of data can affect the measures of center and spread. Thursday, September 11, 2014
Class Record Chart for Head Circumference Size (to the nearest centimeter)
Mean • Mean: • A measure of center, also known as average. • Mean is the sum of a set of data divided by the number of data items.
Median • Median: • A measure of center, that tells the middle number in a set of data. • If there is no single middle item, the number halfway between the two data items closest to the middle is the median. • Basically…just find the mean of the two middle numbers.
Mode • Mode: • A measure of center for a set of data that tells the item(s) that appear most often in data set. • There can be no mode. • There can also be more than one mode
Range • Range: • A measure of spread. • The difference (subtraction) between the greatest data value and least value in a data set.
Analyzing Measures of Center • Which MEASURE OF CENTER (mean, median, or mode) best represents our data? Explain your reasoning below in complete sentences.
How do Outliers Data Measurements? • Predict: What if someone with a head circumference of 100 cm came into our class. How would this affect our data? • How would this change the mean? • How would this change the mode? • How would this change the median? • How would this change the range? • Discussion Question: • Which data measurement would be most affected by the addition of the outlier? WHY?
Which of the following statements is true about the data displayed in the Stem-and-Leaf Plot below? 0 5 8 9 1 2 4 5 7 9 2 4 8 8 8 3 0 0 3 • The mode for the set of data is 30. • The median for the set of data is 24. • The mean for the set of data is 20. • The range of the set of data is 3. Key: 1 7 = 17
Mr. Cain has recorded the scores on his latest test in the stem and leaf plot below. He needs to report his test scores to Mrs. Green using a measure of center. Which of the following measurements should Mr. Cain use if he wants to report the highest measurement? 5 6 5 5 5 5 7 0 7 8 4 8 9 1 6 10 0 0 0 • Mean • Median • Mode • They are all the same! Key: 1 7 = 17