Download
1 / 121
1.23k likes | 1.44k Vues
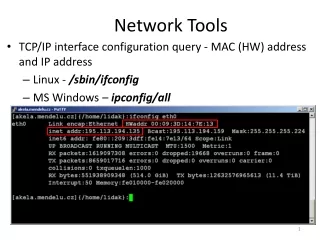
Network Management Tools Presentations. Tuesday, September 18 th & 25 th , 2007 CSE 552 – Network Management Fall 2007 (Term 071) Assignment 2. Schedule of Presentations. NM Tool (Nagios) CSE-552 Assignment#2. Karim Asif Sattar Muhamad Khaled Alhamwi. Outline. Nagios Hosts Services

E N D
Network Management ToolsPresentations Tuesday, September 18th & 25th, 2007 CSE 552 – Network Management Fall 2007 (Term 071) Assignment 2
NM Tool (Nagios)CSE-552 Assignment#2 Karim Asif Sattar Muhamad Khaled Alhamwi
Outline • Nagios • Hosts • Services • Configuration files • Configuration Example • Snapshots • Q & A
Nagios • Free & open-source network management tool • Run under Linux • Has web interface • Can be viewed remotely • Can be used to monitor your host and services • Very flexible • Many plug-ins and add-ons
Nagios – cont’ • Not SNMP-based NM tool • Monitor Windows & Linux hosts • Monitor any service • You just need to write the appropriate plug-in • Monitor public services • HTTP, DNS, Email • Monitor private services with the help of other add-ons • CPU, Memory, and Disk usage
Checking Private Services • NSClient++ • Add-on can be used to check Windows hosts Daemon Plug-in Add-on
Hosts • Hosts can be defined with parent-child relation • Useful to reflect the real topology • Hosts can be grouped in different groups • Monitored host has several possible states • UP – The host is up and running • DOWN – The host is not responding • UNREACHABLE – The host can not be reached because some other host in between is down
Services • Services can be grouped in different services • Monitored Service has several possible states • OK – The service is running and performance metric is within the normal range • WARNING – The service is running and performance metric is above normal but below critical range • CRITICAL – The service is not running (crashed) or the performance metric is above critical threshold • UNKNOWN – Unknown error
Configuration files • Main configuration file (includes other files) • nagios.cfg • CGI configuration file (web interface) • cgi.cfg • Check command configuration file • commands.cfg • Hosts configuration • hosts.cfg • Services configuration • services.cfg • You can name the files as you like, and include them in main configuration file • cfg_file=<file_name>
Example • Monitoring of two machines • Localhost (on which nagios is installed) – Linux • Checks for private resources on the localhost • Number of processes, users, Disk usage, and CPU • Another machine on the same subnet – Windows XP • Checks for HTTP service (running) • Checks for DNS service (not installed) • Checks for process “Explorer.exe”
Configuration Example • define host { • use template • host_name localhost • address localhost • …. • } • define host { • use template • host_name Windows host • address 10.90.3.x • …. • }
Configuration Example – cont’ • define service { • service_description Total processes • host_name localhost • check_command check_proc!150!300 • …. • }
Configuration Options • We can define (with examples) • Normal check interval (5 min) • Retry interval (3 min) • Maximum check attempts (4) • Check period (24x7) • Contacts (admin) • Contact groups (admin_group) • Notification period (24x7) • And more…
Snapshots (1) - Authentication • Web interface authentication • Open internet browser and type: • http://localhost/nagios/ in URL field
Thank you • Q & A
The DudeNetwork Management Tool Presentation CSE-552 Network Management Term 071 By M. M. Rizwan Farooqi (250501) Mohammad Rahil Rafiq (260308)
Overview • Introduction • System Requirements • Features • Modes of Operation • Interface Layout • Logs • Probes • Snapshots • Pros. & Cons. • Conclusion • References • Q & A
Introduction • Network monitoring tool that incorporates map of the network layout • It helps you visualize the structure of your network • It also provides direct access to network functions specific to each item. • It can automatically discover your local network and draw a preliminary layout that can be further customized and saved.
System Requirements • RAM: minimum - 64MB, recommended minimum - 128MB • OS: Windows 2000/XP (does not work with Windows 95/98/Me) with Administrator permissions • Video: at least 800x600 resolution
Features • Supports various network monitoring tasks from simple ping checks to port probes and service checks. • Individual Link usage monitoring and graphs. • Direct access to remote control tools for device management. • Helps in checking bandwidth to a device or monitor its traffic in real-time.
Features Contd.. • Automatically detects any existing subnets and begins scanning them. • Detected devices are then probed to determine which IP-based services are supported (like NetBIOS, HTTP, FTP, etc.), • Additional probes for any services can also be configured. • After discovery process, the results are plotted as icons on a map grid including which of its services are up, down, or unstable.
Features Contd.. • How long to wait before timing out a device • Which services are polled on which devices • Window layout is stored on the server rather than the client, so everything set up on the server can be viewed from multiple clients.
Features Contd.. • Supports remote Dude server and local clients. • Supports SNMP, ICMP, DNS and TCP monitoring for devices that support it. • Easy installation • Runs on Linux, Mac OS, and Windows. • Best price/value ratio compared to other products (free of charge).
Modes of Operation • Local – to connect to the local Dude server • Remote – to connect insecurely (nothing is encrypted, not even passwords) to a remote Dude server (uses web based interface) • Secure – to connect securely to a remote Dude server (uses web based interface)
Logs • Debug – shows all changes happening in the system • Action – lists manual operations performed by an administrator (for example, device add/remove events) • Event – stores network events (for example, information about failing services)
Probes • ICMP – regular ping. • TCP – a test, which opens a regular TCP connection to a given port. • DNS – probe the given UDP port (usually, 53) with a valid DNS request for the given domain name. • SNMP – check the specified OID( Object Identifier).
Pros: • Freeware • Lots of customizable options • Useful network mapping features • Separate Client & Server • Uses ftp, http, NetBIOS & ping, SNMP • Export and Import in PNG & PDF format • Email, popup and beep alerts • Secure remote login
Cons: • Rather unintuitive user interface • Device alerts not turned on by default • Minimal and out of date documentation • Web based interface not comprehensive compared to its windows based client
Conclusion • Good Freeware • Cannot work if firewall is enabled. • Separate client and server • No support • Server logout - Dude service closes
References • http://wiki.mikrotik.com/wiki/Dude_usage_notes#Device_Representation • http://www.steveatwal.com/the-dude-free-network-diagramming-tool/ • http://www.smallbusinesscomputing.com/webmaster/article.php/3692871