Download
1 / 54
540 likes | 682 Vues
Performance Engineering of Parallel Applications. Philip Blood, Raghu Reddy Pittsburgh Supercomputing Center. POINT Project. “High-Productivity Performance Engineering (Tools, Methods, Training) for NSF HPC Applications” NSF SDCI, Software Improvement and Support

E N D
Performance Engineering of Parallel Applications Philip Blood, Raghu Reddy Pittsburgh Supercomputing Center
POINT Project • “High-Productivity Performance Engineering (Tools, Methods, Training) for NSF HPC Applications” • NSF SDCI, Software Improvement and Support • University of Oregon, University of Tennessee, National Center for Supercomputing Applications, Pittsburgh Supercomputing Center • POINT project • Petascale Productivity from Open, Integrated Tools • http://www.nic.uoregon.edu/point
Parallel Performance Technology • PAPI • University of Tennessee, Knoxville • PerfSuite • National Center for Supercomputing Applications • TAU Performance System • University of Oregon • Kojak / Scalasca • Research Centre Juelich
Code Development and Optimization Process • Choice of algorithm most important consideration (serial and parallel) • Measurement may reveal need for new algorithm or completely different implementation rather than optimization • Focus of this lecture: using tools to assess parallel performance
Counters: set of registers that count processor events, like floating point operations, or cycles (Opteron has 4 registers, so 4 events can be monitored simultaneously) PAPI: Performance API Standard API for accessing hardware performance counters Enable mapping of code to underlying architecture Facilitates compiler optimizations and hand tuning Seeks to guide compiler improvements and architecture development to relieve common bottlenecks Hardware Counters
Portable: uses same routines to access counters across all architectures High-level interface Using predefined standard events the same source code can access similar counters across various architectures without modification. papi_avail Low-level interface Provides access to all machine specific counters (requires source code modification) Increased efficiency and flexibility papi_native_avail Third-party tools TAU, Perfsuite, IPM Features of PAPI
#include <papi.h> #define NUM_EVENTS 2 main() { int Events[NUM_EVENTS] = {PAPI_TOT_INS, PAPI_TOT_CYC}; long_long values[NUM_EVENTS]; /* Start counting events */ if (PAPI_start_counters(Events, NUM_EVENTS) != PAPI_OK) handle_error(1); /* Do some computation here*/ /* Read the counters */ if (PAPI_read_counters(values, NUM_EVENTS) != PAPI_OK) handle_error(1); /* Do some computation here */ /* Stop counting events */ if (PAPI_stop_counters(values, NUM_EVENTS) != PAPI_OK) handle_error(1); } Example: High-level interface
Measurement Techniques • When is measurement triggered? • Sampling (indirect, external, low overhead) • interrupts, hardware counter overflow, … • Instrumentation (direct, internal, high overhead) • through code modification • How are measurements made? • Profiling • summarizes performance data during execution • per process / thread and organized with respect to context • Tracing • trace record with performance data and timestamp • per process / thread
inclusive duration exclusive duration Inclusive and Exclusive Profiles • Performance with respect to code regions • Exclusive measurements for region only • Inclusive measurements includes child regions int foo() { int a; a = a + 1; bar(); a = a + 1; return a; }
Serial Assess overall serial performance (percent of peak) Identify functions where code spends most time Instrument those functions Measure code performance using hardware counters Identify inefficient regions of source code and cause of inefficiencies Parallel Assess overall parallel performance (scaling) Identify functions where code spends most time (this may change at high core counts) Instrument those functions Identify load balancing issues, serial regions Identify communication bottlenecks--use tracing to help identify cause and effect Performance Engineering: Procedure
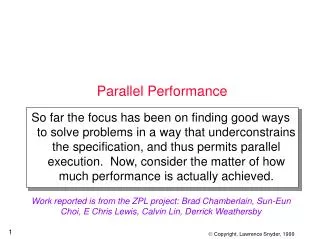
Is There a Performance Problem? • My code takes 3 hrs to run each time! • Does that mean it is performing poorly? • HPL on 4K cores can take a couple of hrs • Depends on the work being done • Performance problems • Single core performance problem? • Scalability problem?
Detecting Performance Problems • Fraction of Peak • 20% peak (overall) is usually decent; After that you decide how much effort is it worth • 80:20 rule • Scalability • Does run time decrease by 2x when I use 2x cores? • Strong scalability • Does run time remain the same when I keep the amount of work per core the same? • Weak scalability
IPM • Very good tool to get an overall picture • Overall MFLOP • Communication/Computation ratio • Pros • Quick and easy! • Minimal overhead • Cons • Needs manual work to drill down http://ipm-hpc.sourceforge.net/
IPM Mechanics On Ranger: 1) module load ipm 2) just before the ibrun command in the batch script add: setenv LD_PRELOAD $TACC_IPM_LIB/libipm.so 3) run as normal 4) to generate webpage module load ipm(if not already) ipm_parse -html <xml_file> You should be left with a directory with the html in. Tar it up, move to to your local computer and open index.html with your browser.
IPM Overhead • Was run with 500 MD steps (time in sec) • base: MD steps: 5.14637E+01 • base-ipm: MD steps: 5.13576E+01 • Overhead is negligible
Serial Assess overall serial performance (percent of peak) Identify functions where code spends most time Instrument those functions Measure code performance using hardware counters Identify inefficient regions of source code and cause of inefficiencies Parallel Assess overall parallel performance (scaling) Identify functions where code spends most time (this may change at high core counts) Instrument those functions Identify load balancing issues, serial regions Identify communication bottlenecks--use tracing to help identify cause and effect Performance Engineering: Procedure
Which Functions are Important? • Usually a handful of functions account for 90% of the execution time • Make sure you are measuring the production part of your code • For parallel apps, measure at high core counts – insignificant functions become significant!
PerfSuite • Similar to IPM: great for getting overall picture of application performance • Pros • Easy: no need to recompile • Minimal overhead • Provides function-level information • Cons • Not available on all architectures: (x86, x86-64, em64t, and ia64) http://perfsuite.ncsa.uiuc.edu/
PerfSuite Mechanics • # First, be sure to set all paths properly (can do in .cshrc/.profile) • % set PSDIR=/opt/perfsuite • % source $PSDIR/bin/psenv.csh • # Use psrun on your program to generate the data, • # then use psprocess to produce an HTML file (default is plain text) • % psrun myprog • % psprocess --html myprog.12345.xml > myprog.html • # Take a look at the results • % your-web-browser myprog.html • # Second run, but this time profiling instead of counting • % psrun –C -c papi_profile_cycles.xml myprog • % psprocess -e myprog myprog.67890.xml POINT Parallel Performance Evaluation Tools: TAU, PerfSuite, PAPI, Scalasca
First case provides hardware counter stats Index Description Counter Value ================================================================= 1 Conditional branch instructions mispredicted..... 4831072449 4 Floating point instructions...................... 86124489172 5 Total cycles..................................... 594547754568 6 Instructions completed........................... 1049339828741 Statistics ================================================================= Graduated instructions per cycle................... 1.765 Graduated floating point instructions per cycle.... 0.145 Level 3 cache miss ratio (data).................... 0.957 Bandwidth used to level 3 cache (MB/s)............. 385.087 % cycles with no instruction issue................. 10.410 % cycles stalled on memory access.................. 43.139 MFLOPS (cycles).................................... 115.905 MFLOPS (wallclock)................................. 114.441 POINT Parallel Performance Evaluation Tools: TAU, PerfSuite, PAPI, Scalasca
Second case gives contributions of functions Function Summary -------------------------------------------------------------------------------- Samples Self % Total % Function 154346 76.99% 76.99% pc_jac2d_blk3 14506 7.24% 84.23% cg3_blk 10185 5.08% 89.31% matxvec2d_blk3 6937 3.46% 92.77% __kmp_x86_pause 4711 2.35% 95.12% __kmp_wait_sleep 3042 1.52% 96.64% dot_prod2d_blk3 2366 1.18% 97.82% add_exchange2d_blk3 Function:File:Line Summary -------------------------------------------------------------------------------- Samples Self % Total % Function:File:Line 39063 19.49% 19.49% pc_jac2d_blk3:/home/rkufrin/apps/aspcg/pc_jac2d_blk3.f:20 24134 12.04% 31.52% pc_jac2d_blk3:/home/rkufrin/apps/aspcg/pc_jac2d_blk3.f:19 15626 7.79% 39.32% pc_jac2d_blk3:/home/rkufrin/apps/aspcg/pc_jac2d_blk3.f:21 15028 7.50% 46.82% pc_jac2d_blk3:/home/rkufrin/apps/aspcg/pc_jac2d_blk3.f:33 13878 6.92% 53.74% pc_jac2d_blk3:/home/rkufrin/apps/aspcg/pc_jac2d_blk3.f:24 11880 5.93% 59.66% pc_jac2d_blk3:/home/rkufrin/apps/aspcg/pc_jac2d_blk3.f:31 8896 4.44% 64.10% pc_jac2d_blk3:/home/rkufrin/apps/aspcg/pc_jac2d_blk3.f:22 7863 3.92% 68.02% matxvec2d_blk3:/home/rkufrin/apps/aspcg/matxvec2d_blk3.f:19 7145 3.56% 71.59% pc_jac2d_blk3:/home/rkufrin/apps/aspcg/pc_jac2d_blk3.f:32 POINT Parallel Performance Evaluation Tools: TAU, PerfSuite, PAPI, Scalasca
Serial Assess overall serial performance (percent of peak) Identify functions where code spends most time Instrument those functions Measure code performance using hardware counters Identify inefficient regions of source code and cause of inefficiencies Parallel Assess overall parallel performance (scaling) Identify functions where code spends most time (this may change at high core counts) Instrument those functions Identify load balancing issues, serial regions Identify communication bottlenecks--use tracing to help identify cause and effect Performance Engineering: Procedure
Instrument Key Functions • Instrumentation: insert functions into source code to measure performance • Pro: Gives precise information about where things happen • Con: High overhead and perturbation of application performance • Thus essential to only instrument important functions
TAU: Tuning and Analysis Utilities • Useful for a more detailed analysis • Routine level • Loop level • Performance counters • Communication performance • A more sophisticated tool • Performance analysis of Fortran, C, C++, Java, and Python • Portable: Tested on all major platforms • Steeper learning curve http://www.cs.uoregon.edu/research/tau/home.php
General Instructions for TAU • Use a TAU Makefile stub (even if you don’t use makefiles for your compilation) • Use TAU scripts for compiling • Example (most basic usage): • Excellent “Cheat Sheet”! • Everything you need to know?! (Almost) http://www.psc.edu/general/software/packages/tau/TAU-quickref.pdf module load tau setenv TAU_MAKEFILE <path>/Makefile.tau-papi-pdt-pgi setenv TAU_OPTIONS "-optVerbose -optKeepFiles“ tau_f90.sh -o hello hello_mpi.f90
Using TAU with Makefiles • Fairly simple to use with well written makefiles: setenv TAU_MAKEFILE <path>/Makefile.tau-papi-mpi-pdt-pgi setenv TAU_OPTIONS "-optVerbose –optKeepFiles –optPreProcess” make FC=tau_f90.sh • run code as normal • run pprof (text) or paraprof (GUI) to get results • paraprof --pack file.ppk (packs all of the profile files into one file, easy to copy back to local workstation) • Example scenarios • Typically you can do cut and paste from here: http://www.cs.uoregon.edu/research/tau/docs/scenario/index.html
Tiny Routines: High Overhead Before: double precision function scalar(u,v) double precision u(3),v(3) scalar=u(1)*v(1)+u(2)*v(2)+u(3)*v(3) return end After: double precision function scalar(u,v) double precision u(3),v(3) call TAU_PROFILE_TIMER(profiler, 'SCALAR […]') call TAU_PROFILE_START(profiler) scalar=u(1)*v(1)+u(2)*v(2)+u(3)*v(3) call TAU_PROFILE_STOP(profiler) return call TAU_PROFILE_STOP(profiler) end
Reducing Overhead Overhead (time in sec): MD steps base: 5.14637E+01 MD steps base with TAU: 3.15578E+02 • Must reduce overhead to get meaningful results: • In paraprof go to “File” and select “Create Selective Instrumentation File”
Selective Instrumentation File • Files to include/exclude • Routines to include/exclude • Directives for loop instrumentation • Phase definitions • Specify the file in TAU_OPTIONS and recompile: setenv TAU_OPTIONS "-optVerbose –optKeepFiles –optPreProcess -optTauSelectFile=select .tau“ • http://www.cs.uoregon.edu/research/tau/docs/newguide/bk03ch01.html
Getting a Call Path with TAU • Why do I need this? • To optimize a routine, you often need to know what is above and below it • Helps with defining phases: stages of execution within the code that you are interested in • To get callpath info, do the following at runtime: setenv TAU_CALLPATH 1 (this enables callpath) setenv TAU_CALLPATH_DEPTH 50 (defines depth)
Getting Call Path Information Right click name of node and select “Show Thread Call Graph”
Phase Profiling: Isolate regions of code execution • Specify a region of the code of interest: e.g. the main computational kernel • Use call path to find where in the code that region begins and ends • Then put something like this in selective instrumentation file: static phase name="foo1_bar“ file="foo.c“ line=26 to line=27 • Recompile and rerun
Serial Assess overall serial performance (percent of peak) Identify functions where code spends most time Instrument those functions Measure code performance using hardware counters Identify inefficient regions of source code and cause of inefficiencies Parallel Assess overall parallel performance (scaling) Identify functions where code spends most time (this may change at high core counts) Instrument those functions Identify load balancing issues, serial regions Identify communication bottlenecks--use tracing to help identify cause and effect Performance Engineering: Procedure
Hardware Counters Hardware performance counters available on most modern microprocessors can provide insight into: • Whole program timing • Cache behaviors • Branch behaviors • Memory and resource access patterns • Pipeline stalls • Floating point efficiency • Instructions per cycle • Subroutine resolution • Process or thread attribution
Detecting Serial Performance Issues • Identify hardware performance counters of interest • papi_avail • papi_native_avail • Run these commands on compute nodes! Login nodes will give you an error. • Run TAU (perhaps with phases defined to isolate regions of interest) • Specify PAPI hardware counters at run time: setenv TAU_METRICS GET_TIME_OF_DAY:PAPI_FP_OPS:PAPI_TOT_CYC
Perf of EELEC (peak is 2) Go to: Paraprof manager Options->”Show derived metrics panel”
Serial Assess overall serial performance (percent of peak) Identify functions where code spends most time Instrument those functions Measure code performance using hardware counters Identify inefficient regions of source code and cause of inefficiencies Parallel Assess overall parallel performance (scaling) Identify functions where code spends most time (this may change at high core counts) Instrument those functions Identify load balancing issues, serial regions Identify communication bottlenecks--use tracing to help identify cause and effect Performance Engineering: Procedure
Further Info on Serial Optimization • Tools help you find issues – solving issues is application and hardware specific • Good resource on techniques for serial optimization: “Performance Optimization of Numerically Intensive Codes” Stefan Goedecker, Adolfy Hoisie, SIAM, 2001.
Serial Assess overall serial performance (percent of peak) Identify functions where code spends most time Instrument those functions Measure code performance using hardware counters Identify inefficient regions of source code and cause of inefficiencies Parallel Assess overall parallel performance (scaling) Identify functions where code spends most time (this may change at high core counts) Instrument those functions Identify load balancing issues, serial regions Identify communication bottlenecks--use tracing to help identify cause and effect Performance Engineering: Procedure
Detecting Parallel Performance Issues: Load Imbalance • Examine timings of functions in your region of interest • To look at load imbalance: • If you defined a phase, from paraprof window, right-click on phase name and select: “Show profile for this phase” • Left-click on function name to look at timings across all processors
Load Imbalance Load imbalance on one processor causing other processors to idle in MPI_Barrier May need to change how data is distributed, or even change underlying algorithm.
Detecting Parallel Performance Issues: Serial Bottlenecks • To identify scaling bottlenecks (including serial regions), do the following for each run in a scaling study (e.g. 2-64 cores): • In Paraprof manager right-click “Default Exp” and select “Add Trial”. Find packed profile file and add it. • If you defined a phase, from main paraprof window select: Windows -> Function Legend-> Filter->Advanced Filtering • Type in the name of the phase you defined, and click ‘OK’ • Return to Paraprof manager, right-click the name of the trial, and select “Add to Mean Comparison Window” • Compare functions across increasing core counts
Function Scaling and Serial Bottlenecks Identify which functions need to scale better, or be parallelized, in order to increase overall scalability. Find which communication routines are starting to dominate runtimes. Use call path information to find where those communication routines are being called
Serial Assess overall serial performance (percent of peak) Identify functions where code spends most time Instrument those functions Measure code performance using hardware counters Identify inefficient regions of source code and cause of inefficiencies Parallel Assess overall parallel performance (scaling) Identify functions where code spends most time (this may change at high core counts) Instrument those functions Identify load balancing issues, serial regions Identify communication bottlenecks--use tracing to help identify cause and effect Performance Engineering: Procedure
Generating a Trace • At runtime: setenv TAU_TRACE 1 • Follow directions here to analyze: http://www.psc.edu/general/software/packages/tau/TAU-quickref.pdf • Insight into causes of communication bottlenecks • Duration of individual MPI calls • Use of blocking calls • Posting MPI calls too early or too late • Opportunities to overlap computation and communication