Download
1 / 25
260 likes | 467 Vues
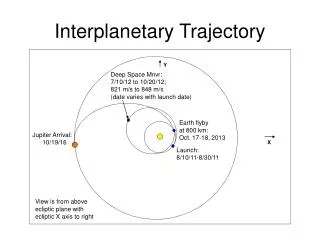
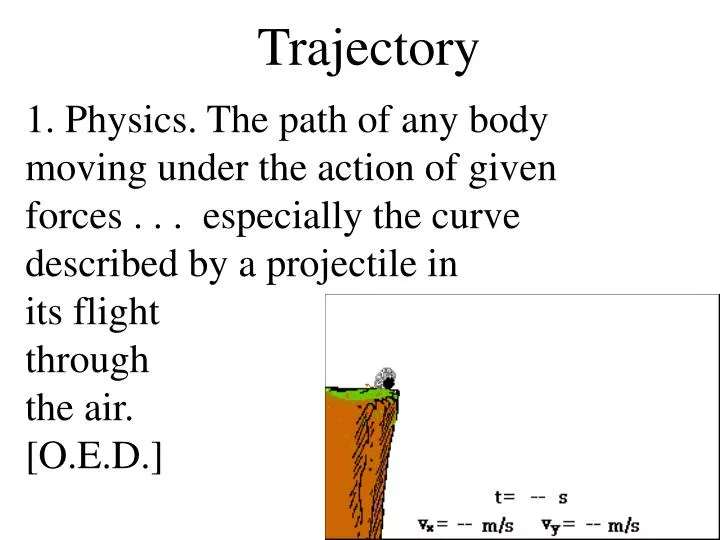
Trajectory. 1. Physics. The path of any body moving under the action of given forces . . . especially the curve described by a projectile in its flight through the air. [O.E.D.]. Multimedia Physics Studios. Cluster Analysis of Cases.

E N D
Trajectory 1. Physics. The path of any body moving under the action of given forces . . . especially the curve described by a projectile in its flight through the air. [O.E.D.] Multimedia Physics Studios
Cluster Analysis of Cases • Cluster analysis of cases “dissects” a sample into distinct groups of individuals. • It takes a sample and makes a pie chart. • Clusters are a categorical variable. Everyone becomes a 1, 2 or 3. • Generally not discovering “God-given” categories • Constructing a data-based typology
Two Good Ways to Find Distinct Developmental Trajectories • Muthen2 Growth curve mixture modeling with MPLUS • http://www.statmodel.com/index2.html • Nagin & Jones PROC TRAJ http://www.ncovr.org/docs/Special_Project/Trajectory/index.htm
Free download from Carnegie Mellon. Easily installed. Runs as a SAS PROC Produces trajectorycharts automatically Parsimonious Model published in Psychological Methods(1999, 2001) Many studies injuvenile justice Nagin & Jones’ PROC TRAJ Two-group logistic model from CM WWW site.
Basic Readings • Helgeson, V.S., et al., Psychological and physical adjustment to breast cancer over 4 years: identifying distinct trajectories of change. Health psychology : official journal of the Division of Health Psychology, American Psychological Association., 2004. 23(1): p. 3-15. • Jones, B.L., D.S. Nagin, and K. Roeder, A SAS Procedure based on mixture models for estimating developmental trajectories. Sociological Methods and Research, 2001. 29: p. 374-393. • Nagin, D.S., Analyzing developmental trajectories: A semiparametric, group-based approach. Psychological Methods, 1999. 4(2): p. 139-157.
Trajectories Based on Continuous Variables J. Child Psychology & Psychiatry
Trajectory Analysis vs. Longitudinal HLM Different • HLM, pre-existing groups • TRAJ, discover groups • HLM, confirmatory • TRAJ exploratory • HLM, powerful general purpose tool • TRAJ, interesting special purpose tool Similar • Individual growth curves • Model based, within children & between children • Iterative software • Graphic results, not just p values
Individual Growth Curves of Continuous Outcome Distress of child i at time t Distress(i,t) = βi0 + βi1t+ βi2t2 . . . β0 the intercept, the score at time zero β1 the linear slope, indicating a constant increase or decrease over time β2 is the quadratic slope indicating a curve of acceleration or deceleration Individuals with missing observations can be included Proc TRAJ goes up to degree 5
Polynomial ApproximationJust a description • Polynomials can approximate almost any shape • Monte Carlo curves • Random betas • Time4
How PROC TRAJ Works Each child has an observed trajectory Each trajectory has an approximate model description Each child is described by several numbers Cases can be sorted into clusters by the several numbers Nagin developed the statistical theory Jones wrote PROC TRAJ software (free download)
Trajectories Based on an Indicator Membership in a delinquent group at a given time (No, Yes)
Trajectories in Health Psychology Well-done example of trajectory analysis with PROC TRAJ N = 287 women surviving cancer
Parallel Trajectories Are Less Informative Scott Holupka & Debra Rog VU Washington DC
Two Examples of Trajectory Analysis Inattentive ADHD Symptoms in a High Risk Group N = 267 school children Recurrent Abdominal Pain (RAP) in children with no medical diagnosis
The Average Child? Try to Find Them! • Children, K to 4 • 243 school children “at risk” • 68% boys • At risk for ADHD • MD diagnosis • Teacher screen or • Followed 3 years • Teacher ratings • Inattentive symptoms • Six or more is positive The average child with ADHD gets somewhat better over 3 years Bickman, Wolraich, Lambert & Simmons in prep One size fits none
ADHD Trajectories (unsuccessful)Only one group resembles the mean • Clinical chronic 61% • Starts clinical (6 or more) • Slight improvement • Clinical improving 30% • Starts clinical • Remission by 1 year • Subclinical • Starts normal • Stays normal
CSI trajectories for entire sample (means and standard deviations) “Children with RAP improve briefly then stay the same at a moderate level for 4-5 years.” Is that what this chart really says? (Note Std Dev) Let’s try PROC TRAJ. Children with RAP, Recurrent Abdominal PainGrand Means Are Deceiving
How do we find trajectories?TRAJPLOT Macro Shows each solution
Bayesian Information Criterion (BIC) values for CSI models How do we find trajectories?Best Fit: 2, 3, or 4 Clusters
How do we find trajectories?Rejecting a 4-trajectory solution Group Size Prob. 1 (21.2%) . 2 (67.1%) 0.0004 3 ( 1.7%) 0.0022Gp 3 tiny 4 (10.0%) 0.0874Gp 1-Gp 4 nonsig Four clusters not acceptable because there are not 4 distinct clusters. In addition, cluster 3 is too small. Knowing when to stop . . .
Example of a 3 Group ModelPROC TRAJ Group Parameter Estimate Prob > |T| 1 Intercept 15.44068 0.0000 Linear -0.68666 0.0002 Quadratic 0.01047 0.0002 2 Intercept 42.87414 0.0000 Linear -2.42765 0.0000 Quadratic 0.03429 0.0000 3 Intercept 33.74592 0.0000 Linear 0.65764 0.1630 Quadratic -0.00597 0.4160
Three Common Trajectories for CSI Long term risk Short term risk Low risk ** p < .01 *** p < .001 one-way ANOVA
Try to Explain the Trajectories with Ordinary Analysis (oneway ANOVA, regression, chi2 etc)Theory based > Fishing Comparison of Characteristics by CSI Symptom Trajectory Group
OK, Officer, we’re fishing for a hypothesis. We’ll test it with fresh data. Like cluster analysis or exploratory factor analysis, TRAJ needs cross validation