Download
1 / 103
1.03k likes | 1.26k Vues
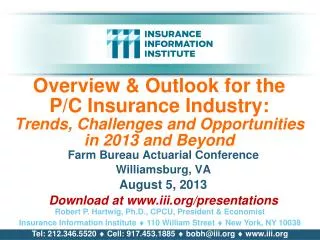
Overview & Outlook for the P/C Insurance Industry: Trends, Challenges and Opportunities in 2013 and Beyond. P/C Insurance Company Survey Group Meeting Washington, DC August 19, 2013. Robert P. Hartwig, Ph.D., CPCU, President & Economist

E N D
Overview & Outlook for the P/C Insurance Industry:Trends, Challenges and Opportunitiesin 2013 and Beyond P/C Insurance Company Survey Group Meeting Washington, DC August 19, 2013 Robert P. Hartwig, Ph.D., CPCU, President & Economist Insurance Information Institute 110 William Street New York, NY 10038 Tel: 212.346.5520 Cell: 917.453.1885 bobh@iii.org www.iii.org
P/C Insurance Industry Financial Overview So Far, So Good: Profit Recovery in 2013 After High CAT Losses in 2011-12 2
P/C Net Income After Taxes1991–2013:Q1 ($ Millions) • 2005 ROE*= 9.6% • 2006 ROE = 12.7% • 2007 ROE = 10.9% • 2008 ROE = 0.1% • 2009 ROE = 5.0% • 2010 ROE = 6.6% • 2011 ROAS1 = 3.5% • 2012 ROAS1 = 5.9% • 2013:Q1 ROAS1 = 9.6% 2012:Q1 ROAS was 7.2% Net income is up substantially (+40.9%) from 2012:Q1 $10.2B • ROE figures are GAAP; 1Return on avg. surplus. Excluding Mortgage & Financial Guaranty insurers yields a 9.7% ROAS in 2013:Q1, 6.2% ROAS in 2012, 4.7% ROAS for 2011, 7.6% for 2010 and 7.4% for 2009. • Sources: A.M. Best, ISO, Insurance Information Institute
Profitability Peaks & Troughs in the P/C Insurance Industry, 1975 – 2013:Q1* History suggests next ROE peak will be in 2016-2017 ROE 1977:19.0% 1987:17.3% 2006:12.7% 10 Years 1997:11.6% 2013:Q1 9.7% 10 Years 9 Years 2012: 5.9% 1984: 1.8% 1975: 2.4% 1992: 4.5% 2001: -1.2% *Profitability = P/C insurer ROEs. 2011-13 figures are estimates based on ROAS data. Note: Data for 2008-2013 exclude mortgage and financial guaranty insurers. Source: Insurance Information Institute; NAIC, ISO, A.M. Best.
A 100 Combined Ratio Isn’t What ItOnce Was: Investment Impact on ROEs A combined ratio of about 100 generates an ROE of ~7.0% in 2012, ~7.5% ROE in 2009/10,10% in 2005 and 16% in 1979 Combined Ratio / ROE Catastrophes and lower investment income pulled down ROE in 2012 Combined Ratios Must Be Lower in Today’s DepressedInvestment Environment to Generate Risk Appropriate ROEs * 2008 -2012 figures are return on average surplus and exclude mortgage and financial guaranty insurers. 2012 combined ratio including M&FG insurers is 103.2, 2011 combined ratio including M&FG insurers is 108.1, ROAS = 3.5%. Source: Insurance Information Institute from A.M. Best and ISO data.
The Strength of the Economy Will Influence P/C Insurer Growth Opportunities Growth Will Expand Insurer Exposure Base Across Most Lines 9
US Real GDP Growth* The Q4:2008 decline was the steepest since the Q1:1982 drop of 6.8% Real GDP Growth (%) Recession began in Dec. 2007. Economic toll of credit crunch, housing slump, labor market contraction was severe 2013 is expected to see uneven growth, then gradually accelerate throughout the year and into 2014 Demand for Insurance Continues To Be Impacted by Sluggish Economic Conditions, but the Benefits of Even Slow Growth Will Compound and Gradually Benefit the Economy Broadly * Estimates/Forecasts from Blue Chip Economic Indicators. Source: US Department of Commerce, Blue Economic Indicators 8/13; Insurance Information Institute.
Real GDP by State Percent Change, 2012:Highest 25 States North Dakota was the economic growth juggernaut of the US in 2012—by far Only 10 states experienced growth in excess of 3%, which is what we would see nationally in a more typical recovery Sources: US Bureau of Labor Statistics; Insurance Information Institute.
Real GDP by State Percent Change, 2012: Lowest 25 States Growth rates in 8 states (and DC) were still below 1% in 2012 Connecticut was the only state to shrink in 2012 Sources: US Bureau of Labor Statistics; Insurance Information Institute.
Consumer Sentiment Survey (1966 = 100) January 2010 through July 2013 Optimism among consumers has remained fairly strong despite tax hikes, federal budget concerns. July’s reading was the highest since July 2007 Consumer confidence has been low for years amid high unemployment, falling home prices and other factors adversely impact consumers, but improved substantially over the past two years Source: University of Michigan; Insurance Information Institute
Auto/Light Truck Sales, 1999-2019F Job growth and improved credit market conditions will boost auto sales in 2013 and beyond (Millions of Units) New auto/light truck sales fell to the lowest level since the late 1960s. Forecast for 2013-14 is still below 1999-2007 average of 17 million units, but a robust recovery is well underway. Truck purchases by contractors are especially strong Car/Light Truck Sales Will Continue to Recover from the 2009 Low Point, Bolstering the Auto Insurer Growth and the Manufacturing Sector Along With Workers Comp Exposures Source: U.S. Department of Commerce; Blue Chip Economic Indicators (8/13 and 3/13); Insurance Information Institute.
Average Age of Vehicles on the Road, 2006—2013 Average vehicle age continues to increase because the slow economy leads many drivers to keep cars on the road longer and because cars are becoming more reliable The average vehicle age reached a record 11.4 years in 2013 Average Vehicle Age (Years) The average age of a vehicle on the road is is expected to continue to increase until 2018. By 2018, the number of vehicles 12+ years old is expected to rise 11.6% from 2013 and the number that are under 5 years old is expected to increase by 41% Sources: Polk, August 2013 Survey; Insurance Information Institute. 19 12/01/09 - 9pm eSlide – P6466 – The Financial Crisis and the Future of the P/C
Monthly Change* in Auto Insurance Prices, 1991–2013* Cyclical peaks in PP Auto tend to occur approximately every 10 years (early 1990s, early 2000s and likely the early 2010s) Pricing peak occurred in late 2010 at 5.3%, falling to 2.8% by Mar. 2012 “Hard” markets tend to occur during recessionary periods The July 2013 reading of 3.6% is up from 3.4% a year earlier *Percentage change from same month in prior year; through July 2013; seasonally adjusted Note: Recessions indicated by gray shaded columns. Sources: US Bureau of Labor Statistics; National Bureau of Economic Research (recession dates); Insurance Information Institutes. 20 12/01/09 - 9pm eSlide – P6466 – The Financial Crisis and the Future of the P/C
New Private Housing Starts, 1990-2019F Job growth, low inventories of existing homes, low mortgage rates and demographics are stimulating new home construction for the first time in years (Millions of Units) New home starts plunged 72% from 2005-2009; A net annual decline of 1.49 million units, lowest since records began in 1959 Insurers Are Starting to See Meaningful Exposure Growth for the First Time Since 2005 Associated with Home Construction: Construction Risk Exposure, Surety, Commercial Auto; Potent Driver of Workers Comp Exposure Source: U.S. Department of Commerce; Blue Chip Economic Indicators (8/13 and 3/13); Insurance Information Institute.
Average Premium forHome Insurance Policies** Countrywide Home Insurance Expenditures Increased by an Estimated 4.0% in 2011-2013 * Insurance Information Institute Estimates/Forecasts **Excludes state-run insurers. Source: NAIC, Insurance Information Institute estimates for 2011-2013 based on CPI data and other data. eSlide – P6466 – The Financial Crisis and the Future of the P/C
Construction Employment,Jan. 2010—July 2013* (Thousands) Construction employment growth accelerated in the second half of 2012 but flattened out by mid-2013. Construction is a key driver of workers comp exposure growth. *Seasonally adjusted Sources: US Bureau of Labor Statistics at http://data.bls.gov; Insurance Information Institute. 26 12/01/09 - 9pm eSlide – P6466 – The Financial Crisis and the Future of the P/C
Nonfarm Payroll (Wages and Salaries):Quarterly, 2005–2013:Q2 Billions Latest (2013:Q2) was $7.09 trillion, a new peak--$762B above 2009 trough Prior Peak was 2008:Q1 at $6.60 trillion Payrolls are 13.4% above their 2009 trough and up 2.7% over the past year Recent trough (2009:Q3) was $6.25 trillion, down 5.3% from prior peak Note: Recession indicated by gray shaded column. Data are seasonally adjusted annual rates. Sources: http://research.stlouisfed.org/fred2/series/WASCUR; National Bureau of Economic Research (recession dates); Insurance Information Institute. 28 12/01/09 - 9pm eSlide – P6466 – The Financial Crisis and the Future of the P/C
Value of Construction Put in Place, June 2013 vs. June 2012* Growth (%) Private: +9.7% Public: -9.3% Public sector construction activity remains depressed Private sector construction activity is up in the residential segment but down in nonresidential Overall Construction Activity is Up, But Growth Is Entirely in the Private Sector as State/Local Government Budget Woes Continue *seasonally adjustedSource: U.S. Census Bureau, http://www.census.gov/construction/c30/c30index.html ; Insurance Information Institute.
Value of Public Construction Put in Place, by Segment, June 2013 vs. June 2012* Transportation and Power projects lead public sector construction Growth (%) Public sector construction activity is down substantially in most segments, a situation that will likely persist, dragging on public entity risk exposures Public Construction Activity is Down in Many Segments as State and Local Budgets Remain Under Stress; Improvement Possible in 2014. *seasonally adjustedSource: U.S. Census Bureau, http://www.census.gov/construction/c30/c30index.html ; Insurance Information Institute.
ISM Manufacturing Index (Values > 50 Indicate Expansion) January 2010 through July 2013 Manufacturing expanded in May, albeit modestly The manufacturing sector expanded for 39 of the 43 months from Jan. 2010 through June 2013. Recent weakness stems largely from woes in Europe and a Slowdown in China. Source: Institute for Supply Management at http://www.ism.ws/ismreport/mfgrob.cfm; Insurance Information Institute.
Manufacturing Growth for Selected Sectors, 2013 vs. 2013* Growth (%) Non-Durables: +0.2% Durables: +2.5% Manufacturing of durable goods was especially strong in 2012 but weakened in 2013 Manufacturing Is Expanding—Albeit More Slowly—Across a Number of Sectors that Will Contribute to Growth in Insurable Exposures Including: WC, Commercial Property, Commercial Auto and Many Liability Coverages *Seasonally adjusted; Date are YTD comparing data through May 2013 to the same period in 2012.Source: U.S. Census Bureau, Full Report on Manufacturers’ Shipments, Inventories, and Orders, http://www.census.gov/manufacturing/m3/
Manufacturing Employment,Jan. 2010—July 2013* Manufacturing employment is up by more than 500,000 or 4.5% since Jan. 2010—a surprising source of strength in the economy. The sector has weakened recently as US corporations remains cautious and Europe, China slow. (Thousands) *Seasonally adjusted Sources: US Bureau of Labor Statistics at http://data.bls.gov; Insurance Information Institute. 38 12/01/09 - 9pm eSlide – P6466 – The Financial Crisis and the Future of the P/C
ISM Non-Manufacturing Index (Values > 50 Indicate Expansion) January 2010 through July 2013 Optimism among non-manufacturers is stable and remains expansionary in 2013 Non-manufacturing industries have been expanding and adding jobs. The question is whether this will continue. Source: Institute for Supply Management at http://www.ism.ws/ismreport/nonmfgrob.cfm; Insurance Information Institute.
Business Bankruptcy Filings,1980-2012 % Change Surrounding Recessions 1980-82 58.6% 1980-87 88.7% 1990-91 10.3% 2000-01 13.0% 2006-09 208.9%* 2012 bankruptcies totaled 40,075, down 16.2% from 2011—the third consecutive year of decline. Business bankruptcies more than tripled during the financial crisis. Significant Exposure Implications for All Commercial Lines as Business Bankruptcies Begin to Decline Sources: American Bankruptcy Institute at http://www.abiworld.org/AM/AMTemplate.cfm?Section=Home&TEMPLATE=/CM/ContentDisplay.cfm&CONTENTID=61633; Insurance Information Institute 40 12/01/09 - 9pm eSlide – P6466 – The Financial Crisis and the Future of the P/C
Private Sector Business Starts, 1993:Q2 – 2012:Q4* Business Starts2006: 872,0002007: 843,0002008: 790,0002009: 697,000 2010: 742,000 2011: 748,000 2012: 769,000 (Thousands) Business starts were up 2.8% in 2012 to 769,000 following a 2.2% gain to 748,000 in 2011. Start-ups could accelerate in 2013. Business Starts Were Down Nearly 20% in the Recession, Holding Back Most Types of Commercial Insurance Exposure, But Are Recovering Slowly * Data through Dec. 30, 2012 are the latest available as of Aug. 16, 2013; Seasonally adjusted. Source: Bureau of Labor Statistics, http://www.bls.gov/news.release/cewbd.t08.htm. 41 12/01/09 - 9pm eSlide – P6466 – The Financial Crisis and the Future of the P/C
12 Industries for the Next 10 Years: Insurance Solutions Needed Health Care Health Sciences Energy (Traditional) Many industries are poised for growth, though insurers’ ability to capitalize on these industries varies widely Alternative Energy Petrochemical Agriculture Natural Resources Technology (incl. Biotechnology) Light Manufacturing Insourced Manufacturing Export-Oriented Industries Shipping (Rail, Marine, Trucking, Pipelines)
U.S. Insured Catastrophe Loss Update Catastrophe Losses in Recent Years Have Been Very High 44
U.S. Insured Catastrophe Losses ($ Billions, 2012 Dollars) 2012 was likely the third most expensive year ever for insured CAT losses 2012 Was the 3rd Highest Year on Record for Insured Losses in U.S. History on an Inflation-Adj. Basis. 2011 Losses Were the 6th Highest. YTD 2013 Running Below Average But Q3 Is Typically the Costliest Quarter. Record tornado losses caused 2011 CAT losses to surge *Through 6/2/13. Includes $2.6B for 2013:Q1 (PCS) and $5.32B for the period 4/1 – 6/2/13 (Aon Benfield Monthly Global Catastrophe Recap). Note: 2001 figure includes $20.3B for 9/11 losses reported through 12/31/01 ($25.9B 2011 dollars). Includes only business and personal property claims, business interruption and auto claims. Non-prop/BI losses = $12.2B ($15.6B in 2011 dollars.) Sources: Property Claims Service/ISO; Insurance Information Institute. 45 12/01/09 - 9pm eSlide – P6466 – The Financial Crisis and the Future of the P/C
Moore, OK, Tornado: Media Coverage Was Generally Favorable Industry had a highly visible, rapid response as Catastrophe Response Teams massed at the “Command Center” at the First Baptist Church in Moore within 48 hours Developed good working relationship with OK Insurance Commissioner John Doak 46 12/01/09 - 9pm eSlide – P6466 – The Financial Crisis and the Future of the P/C
Top 16 Most Costly Disastersin U.S. History (Insured Losses, 2012 Dollars, $ Billions) Hurricane Sandy could become the 4th or 5thcostliest event in US insurance history Includes Joplin, MO, tornado Includes Tuscaloosa, AL, tornado 12 of the 16 Most Expensive Events in US History Have Occurred Over the Past Decade Hurricane Irene became the 12th most expense hurricane in US history in 2011 *PCS estimate as of 4/12/13. Sources: PCS; Insurance Information Institute inflation adjustments to 2012 dollars using the CPI.
Natural Disasters in the United States, 1980 – June 2013*Number of Events (Annual Totals 1980 – June 2013*) There were 68 natural disaster events in the first half of 2013 Number 41 19 121 3 Meteorological (storm) Climatological (temperature extremes, drought, wildfire) Geophysical (earthquake, tsunami, volcanic activity) Hydrological (flood, mass movement) *Through June 30, 2013. Source: MR NatCatSERVICE 49
Losses Due to Natural Disasters in the US, 1980–2012 (Overall & Insured Losses) (Overall and Insured Losses) (2012 Dollars, $ Billions) 2012 Losses Overall : $101.1B Insured: $57.9B 2012 was the 2nd or 3rd most expensive year on record for insured catastrophe losses in the US. Approximately 57% of the overall cost of catastrophes in the US was covered by insurance in 2012 Insured losses (in 2012 values) Overall losses (in 2012 values) Source: MR NatCatSERVICE 52
U.S. Thunderstorm Loss Trends, 1980 – June 30, 2013 Hurricanes get all the headlines, but thunderstorms are consistent producers of large scale loss. 2008-2012 are the most expensive years on record. Average thunderstorm losses are up 7 fold since the early 1980s. The 5- year running average loss is up sharply. 1st Half 2013 thunderstorm losses total $6.325B; The system that included the EF-5 tornado in Moore, OK, accounted for $1.575B Source: Property Claims Service, MR NatCatSERVICE 57
Top 12 Most Costly Hurricanesin U.S. History (Insured Losses, 2012 Dollars, $ Billions) 10 of the 12 most costly hurricanes in insurance history occurred over the past 9 years (2004—2012) Hurricane Sandy became the 3rdcostliest hurricanein US insurance history Hurricane Irene became the 12th most expensive hurricane in US history in 2011 *PCS estimate as of 4/12/13. Sources: PCS; Insurance Information Institute inflation adjustments to 2012 dollars using the CPI.
Outlook for 2013 Hurricane Season: 75% Worse Than Average Source: Philip Klotzbach and Dr. William Gray, Colorado State University, June 2013, accessed at http://tropical.atmos.colostate.edu/forecasts/2013/apr2013/apr2013.pdf ; Insurance Information Institute..
Inflation Adjusted U.S. Catastrophe Losses by Cause of Loss, 1992–20111 Wind/Hail/Flood (3), $14.8 Fires (4), $6.0 Insured cat losses from 1992-2011 totaled $384.3B, an average of $19.2B per year or $1.6B per month Other (5), $1.4 Geological Events, $18.2 Terrorism, $24.4 Winter Storms, $28.2 Hurricanes & Tropical Storms, $161.3 Tornado share of CAT losses is rising Wind losses are by far cause the most catastrophe losses, even if hurricanes/TS are excluded. Tornadoes (2), $130.2 Catastrophes are defined as events causing direct insured losses to property of $25 million or more in 2009 dollars. Excludes snow. Does not include NFIP flood losses Includes wildland fires Includes civil disorders, water damage, utility disruptions and non-property losses such as those covered by workers compensation. Source: ISO’s Property Claim Services Unit.
Homeowners Insurance Catastrophe-Related Claim Frequency and Severity, 1997—2012* Avg. catastrophe claim cost rose approximately 200% from 1997-2011 Cat claim frequency in 2011 was at historic highs and more than double the rate in 1997 *All policy forms combined, countrywide. Source: Insurance Research Council, Trends in Homeowners Insurance Claims, Sept. 2012 from ISO Fast Track data. 73
Combined Ratio Points Associated with Catastrophe Losses: 1960 – 2012* Avg. CAT Loss Component of theCombined Ratio by Decade 1960s: 1.04 1970s: 0.85 1980s: 1.31 1990s: 3.39 2000s: 3.52 2010s: 7.20* Catastrophe losses as a share of all losses reached a record high in 2012 Combined Ratio Points The Catastrophe Loss Component of Private Insurer Losses Has Increased Sharply in Recent Decades Notes: Private carrier losses only. Excludes loss adjustment expenses and reinsurance reinstatement premiums. Figures are adjusted for losses ultimately paid by foreign insurers and reinsurers. Source: ISO (1960-2011); A.M. Best (2012E) Insurance Information Institute.
Homeowners Insurance Combined Ratio: 1990–2015F Hurricane Andrew Record tornado activity Hurricane Sandy Hurricane Ike Homeowners Performance in 2011/12 Impacted by Large Cat Losses. Extreme Regional Variation Can Be Expected Due to Local Catastrophe Loss Activity Sources: A.M. Best (1990-2011);Conning (2012E-2015F); Insurance Information Institute.
Federal Disaster Declarations Patterns: 1953-2013 Disaster Declarations Set New Records in Recent Years 76
Number of Federal Disaster Declarations, 1953-2013* There have been 2,130 federal disaster declarations since 1953. The average number of declarations per year is 35 from 1953-2012, though there few haven’t been recorded since 1995. The number of federal disaster declarations set a new record in 2011, with 99, shattering 2010’s record 81 declarations. 40 federal disasters were declared so far in 2013* The Number of Federal Disaster Declarations Is Rising and Set New Records in 2010 and 2011. Hurricane Sandy Produced 13 Declarations in 2012/13. *Through August 15, 2013. Source: Federal Emergency Management Administration; http://www.fema.gov/disasters; Insurance Information Institute.
Federal Disasters Declarations by State, 1953 – 2013: Highest 25 States* Over the past 60 years, Texas has had the highest number of Federal Disaster Declarations *Through Aug. 7, 2013. Includes Puerto Rico and the District of Columbia. Source: FEMA: http://www.fema.gov/news/disaster_totals_annual.fema; Insurance Information Institute.
Federal Disasters Declarations by State, 1953 – 2013: Lowest 25 States* Over the past 60 years, Wyoming and Rhode Island had the fewest number of Federal Disaster Declarations *Through Aug. 15, 2013. Includes Puerto Rico and the District of Columbia. Source: FEMA: http://www.fema.gov/news/disaster_totals_annual.fema; Insurance Information Institute.
Public Opinion Survey Industry Favorability Ratings Policy Forms & Disclosure Disaster Preparedness 95
I.I.I. Poll: Favorability Percent of Public Rating Industry as Very or Mostly Favorable, 2013 Viewed separately, auto and home insurers have highest favorability ratings of all industries surveyed Auto Insurers and Home Insurers Ranked Highest. Source: Insurance Information Institute Annual Pulse Survey. eSlide – P6466 – The Financial Crisis and the Future of the P/C
I.I.I. Poll: Homeowners Insurance Q. Do you think that it is fair that people who live in areas affected by record storms in 2011 and 2012 should pay more for their homeowners insurance in the future? Don’t know Public believes it is not fair to raise premiums of homeowners due to events they cannot control No Yes Nearly 60 percent of Americans believe that homeowners insurance premiums should not be raised as a result of recent storms in their areas. Source: Insurance Information Institute Annual Pulse Survey. eSlide – P6466 – The Financial Crisis and the Future of the P/C
I.I.I. Poll: Flood Insurance Q. The federal government plans to raise the price of flood insurance so it reflects the costs of paying claims. Do you believe this is fair? [% Responding “NO”] Most people believe it is unfair for government to raise flood insurance premiums, even though they are subsidized by taxpayers More than one-half of Americans do not think it is fair for the federal government to raise its flood insurance premiums to better reflect claims payouts. Source: Insurance Information Institute Annual Pulse Survey. eSlide – P6466 – The Financial Crisis and the Future of the P/C
I.I.I. Poll: Disaster Preparedness Q. If you expect some relief from the government, do you purchase less insurance coverage against these natural disasters than you would have otherwise? Don’t know More than 20 percent cut back on insurance coverage in expectation of government disaster aid Yes No Seventy-two percent of Americans would not purchase less insurance if they expect some relief from the government—but 22% would. Source: Insurance Information Institute Annual Pulse Survey. eSlide – P6466 – The Financial Crisis and the Future of the P/C
Growth Analysis by State and Business Segment Premium Growth Rates Vary Tremendously by State 102
Direct Premiums Written: Total P/CPercent Change by State, 2007-2012* Top 25 States Louisiana was a growth leader over the past 5 years even though premiums written only expanded by 4.5% *Data are preliminary as of 5/1/13 and do not yet fully reflect the impact of state-run pools and plans. Sources: SNL Financial LC.; Insurance Information Institute.