Download
1 / 8
80 likes | 270 Vues
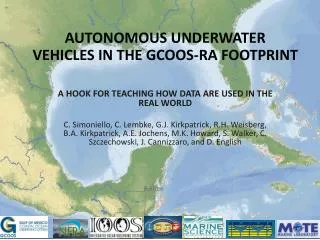
GCOOS. Instructor: Li, Longzhuang Presenter: Mao, Shanxian. GCOOS. Including 8 organizations with 11 data sources. Gulf of Mexico Coastal Ocean Observing System A web-based application that integrates data sources listed on the GCOOS website. Objective of the Project.

E N D
GCOOS Instructor: Li, Longzhuang Presenter: Mao, Shanxian
GCOOS • Including 8 organizations with 11 data sources Gulf of Mexico Coastal Ocean Observing System A web-based application that integrates data sources listed on the GCOOS website
Objective of the Project 1. Satellite Wind Products (COAPS). http://www.coaps.fsu.edu/cgi-bin/qscat/animations.cgi?request=listr®ion=mexi 2. Institute for Marine Remote Sensing for sea surface temperature. http://imars.usf.edu/ 3. Naval Research Laboratory. http://www7333.nrlssc.navy.mil/ 4. Texas Meteorological Satellite Images - POES. http://www.tceq.state.tx.us/compliance/monitoring/air/monops/poes.html 5. Texas Meteorological Satellite Images - GOES. http://www.tceq.state.tx.us/compliance/monitoring/air/monops/goes.html 6. Texas Meteorological Satellite Images - MODIS. http://www.tceq.state.tx.us/compliance/monitoring/air/monops/modis.html 7. AVHRR-SST's latest 3-day's and 7-day's averages from JHU Applied Physics Lab http://fermi.jhuapl.edu/avhrr/gm/index.html 8. Total Perceptible Water Vapor Derived from the GOES-East and GOES-West Sounders. http://cimss.ssec.wisc.edu/goes/realtime/grtmain.html#snpw 9. Lifted Index Derived from the GOES Sounders. http://cimss.ssec.wisc.edu/goes/realtime/grtmain.html#usli 10. Cloud Products Derived from the GOES Sounders. http://cimss.ssec.wisc.edu/goes/realtime/grtmain.html#ctop 11. Total Column Ozone Derived from the GOES Sounders. http://cimss.ssec.wisc.edu/goes/realtime/grtmain.html#ozone To create a GCOOS web-site (global interface) that combines different local sources from the GCOOS organizations Combine 11 local sources:
Global Schema Two predicates: GOMImage(satellite, region, start_date, end_date product, file_type, relative_time) System(satellite, sensor, cluster)
Local Schema • Limitations satellite = “Quick Satellite” region = “GOM” or “Gulf” start date > “07/20/1999” end date < “11/04/2009” For example (one of the 11 data sources) Satellite Wind Products (COAPS): COAPS (satellite, region, start date, end date) b b b f b: required attributes f: optional attributes
Virtual database Different from the real database No any images from local sources stored in this project
Future work • At present: archive data manually from our computers (local machine) to iRODS (server) • A real database Connect to the iRODS – A Large-scale Rule-Oriented Data Management system (A tool of archiving a large amount of data)