Download

1 / 33
330 likes | 441 Vues
Impact assessment of the lone parent pilots. Project team: IFS: Mike Brewer, James Browne, Claire Crawford & Lorraine Dearden. PSI: Genevieve Knight. Main findings & outline of talk. Participation after 12 months of pilots, 6% of eligible LPs received IWC

E N D
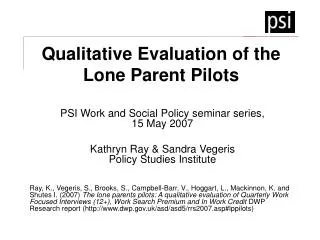
Impact assessment of the lone parent pilots Project team: IFS: Mike Brewer, James Browne, Claire Crawford & Lorraine Dearden. PSI: Genevieve Knight
Main findings & outline of talk • Participation • after 12 months of pilots, 6% of eligible LPs received IWC • But participation still rising in Phase 1 areas after 20 months, so impact may grow • Impact • Small impacts on moves off benefit and into work, particularly for lone parents recently on NDLP • Rest of talk • Methods & data • What might we expect? • Results • Concluding thoughts • All based on DWP Research Report 415 (http://www.dwp.gov.uk/asd/asd5/rports2007-2008/rrep415.pdf).
What are we trying to achieve? • Estimate impact of “lone parent pilots” on labour market outcomes of lone parents previously on IS • Use administrative data • benefit receipt from DWP, employment spells from HMRC (WPLS) • Evaluation will tell us “how much”, not “why”
Why use time-limited in-work benefits? • Wage growth (Connolly & Gottshalk, 2006; Walker and Lydon, 2005) • One-off costs of starting work? • Very high discount rate? • Habits? • Related policies: • SSP (Canada). Reduced welfare claims, increased employment, increased earnings, increased income BUT no long-run effects (Card and Hyslop, 2005; Connolly and Gottshalk, 2002) • UK experience: “Employment credit” for older workers; ERA & Pathways to Work pilots
Work and Pensions Longitudinal Study (WPLS) • Administrative data-set combining • DWP: all benefit claims and participation in NDs from June 1999 • HMRC: data from all P45/P46s (filled in when employers start/stop paying someone) • Matched on NINO plus name, DOB, gender, postcode • Personal information: age, gender, ethnicity and postcode • but can merge other characteristics from other DWP databases. • Outcomes • Which benefits/programmes • Whether in “work” • Doesn’t tell us earnings (yet), hours worked, or hourly wage
WPLS: problems with “work” measure • Lots of noise • Some entries correspond receipt of taxable state benefit • Multiple entries for (apparent) same job • Multiple entries with same start date, different end date • Jobs where start or end known approximately (year, but not day) • Jobs where only end-date known • Jobs at times inconsistent with benefit receipt • Need not include jobs paying < tax threshold • Tax threshold: £91. Min wage * 16 hours: £72 (April 2004). • Does not capture self-employment nor informal employment (but neither would be eligible for IWC)
What outcomes are we measuring, and for whom? • Measure impact on all eligible for IWC • Future work will measure impact on job retention for IWC recipients • Divide eligible lone parents into “stock” and “flow” • Stock: eligible for IWC when pilot starts (large sample) • Flow: become eligible after pilot starts (more interesting in long-run) • Outcomes measured in WPLS for people in WPLS (!) • “whether off IS/JSA/IB X days after first potentially eligible for IWC” • “whether in work X days after first potentially eligible for IWC” • Benefit outcomes until 31/3/06, work outcomes until 30/9/05 • “Work” measure in WPLS based on employers telling HMRC when they start/stop paying an employee • Lots of noise • Does not capture informal employment • Need not include jobs paying < tax threshold (16 hours @ min wage)
Method • “Difference-in-differences” • Compare outcomes in LPP areas with other areas after LPPs started • Compare outcomes in LPP areas with other areas before LPPs started • Attribute any differences to LPP • No sensible control group within the pilot areas • People without children on JSA ? • So use lone parents in all other parts of England as “control areas”, and estimate impact with difference in differences • Don’t identify matched control areas (Blundell et al (2005)) • [Differences between pilot and control areas]
Empirical specification • Outcomes: • off benefit / in work X days after eligibility. • Explanatory variables • History of benefit receipt and work (30 months before eligibility) • Whether claimed disability benefit, JSA, or been on NDLP in 30 months before eligibility, entitlement to IS (at start of claim) • Personal characteristics (when first eligible) • Age, number of children, age of youngest children, ethnicity, gender, month first eligible. • Area characteristics (based on postcode when first eligible) • Indicators for JC+ district, supply of formal childcare (ward, 2003/4), unemployment (TTWA, 2002/3), deprivation quintile (SOA, 2002/3), qualifications of non-working lone parents (SOA, 2001), employment rate (SOA, 2001), % of lone parents who are owner-occupiers (SOA, 2001) • No time trend, but indicators for month • Linear probability model (ie OLS on binary outcome) • Estimate impact • Across all districts (flow only; for stock, separate regression for each phase) • For each phase • For each district • By individual characteristics
In Work Credit: detail • Gradual roll-out: Phase 1 (Apr 2004): Bradford, N London, SE London Phase 2 (Oct 2004): Leicestershire, Dudley and Sandwell, W London, Lancashire W, Staffs, Leeds (+ Cardiff & Edinburgh) Phase 3 (Apr 2005): Brent, City & E London, S London, Lambeth Phase 4 (Oct 2005): Surrey, Sussex, Essex, Kent, Hampshire, IoW, Berks, Bucks, Beds, Herts (not covered) • Five districts also have extra spending for “personal advisers” (ND+fLP) • Affects around a third of LPs • All of London and south-east in pilot areas. Argh!
Sample size: how many are potentially eligible? First eligible after pilot started Eligible on day pilot started
Typical profile: flow Off benefit In work
Typical profile: stock Off benefit In work
Typical profile: lessons • Eligible population is prone to long spells on benefit • After 12 months, 15-20% of flow (10-15% of stock) are off benefit • “Work” measure looks too high, but changes are more plausible. • After 12 months, 5-10 ppt more are in work • Pilot areas have worse outcomes than control areas, particularly Phases 1 & 3 (London)
Corrected, 25/10/06 Take-up (1): ever received IWC as % ever potentially eligible Numerator: DWP financial data (stops Nov 2005). Denominator: WPLS
Take-up (2): new IWC claims as % of benefit exits and % of job starts Numerator: DWP financial data. Denominator: WPLS
Results: flow Control Off benefit after 9 months Phase 1 Phase 2 Phase 3 Differences Date first (potentially) eligible to LPPs
Results: flow Bold and italicised means statistically different from zero
Results: stock (phase 1) Off benefit Days since eligibility to LPPs
Results: stock (phase 2) Off benefit Days since eligibility to programme
Results: stock (phase 3) Off benefit Days since eligibility to programme
Results: stock Bold and italicised means statistically different from zero
Impact by subgroups • Number of children, gender • No consistent pattern & few significant differences • Age of youngest child • Weak (statistically insignificant) evidence that response greater where youngest child age 3 or more • Recent participation in NDLP • Evidence that impact greater for LPs who have recently been on NDLP, but estimate not consistent/stable across districts • By district • Considerable variation • IWC vs ND+fLP areas • Evidence that ND+fLP areas have WORSE outcomes
Results: flow, by age of youngest child Off benefit after 9 months (Results similar amongst stock)
District-level impacts: flow Sig diff from 0 Average (not sig diff from 0) Sig diff from 0
District-level impacts: flow Sig diff from 0 Average IWC (sig diff from 0) Average ND+fLP Sig diff from 0
District-level impacts: stock Sig diff from 0 Average
District-level impacts: stock Sig diff from 0 Average IWC (sig diff from 0) Average ND+fLP
Impact by recent NDLP participation Off benefit after 273/364 days Sig diff from 0 “Recent” = On NDLP 6-12 months before eligible to LPP “Past” = On NDLP 13-30 months before eligible to LPP
Summary of results • Impact • Small impacts on flows off benefit, particularly for lone parents recently on NDLP, and easier to detect in stock sample than flow • Participation • After 12 months, 6% of LPs have received IWC • But participation still rising after 20 months, so impact may grow • Why impact so small? • Either LPs don’t hear about IWC, or they aren’t responding to it yet • Is 0-2 ppts small? Level without treatment is 15-20%
Problems/extensions • “Common trends” • So far, estimated many unrelated regressions • What gain would there be from estimating a duration model with time-varying treatment? • Pilot and control areas are different • Matched difference-in-differences (Blundell et al NDYP) • Not yet used data on receipt of IWC • Joint model of NDLP & IWC & flows off benefit • Impact on retention • Technical report due early 2008, future reports on more data late 2008 & 2010.