Download
1 / 37
390 likes | 558 Vues
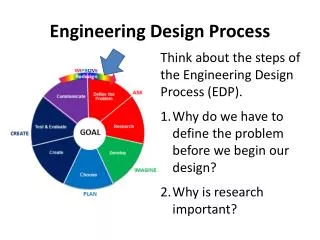
Process engineering. Quality controls. Quality management. Definition Quality management systems (QMS) are policies, processes and procedures put in place to assist in efficient manufacturing.

E N D
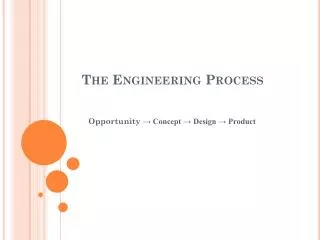
Process engineering Quality controls
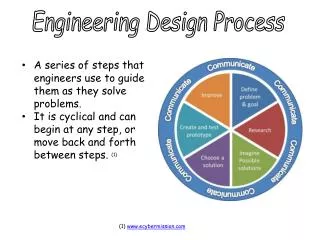
Quality management Definition Quality management systems (QMS) are policies, processes and procedures put in place to assist in efficient manufacturing. This helps an organisation to identify, measure, control and improve processes that lead to improved business performance.
Objectives Advanced product quality planning (APQP) is a quality framework system used for developing the manufacturing process for new products. The aim is to produce a quality product plan that supports the development of a product to satisfy the customers needs. APQP can be applied to any industry.
Why use APQP? The APQP assists with: • Understanding the customer needs • Determine customer needs and translate into product characteristics and requirements. • Proactive feedback and corrective action • Provides other feedback for similar projects with the objective of developing solutions for potential failures.
Why use APQP? The APQP assists with: • Ensuring that the design is within your process capabilities • This brings the processes under statistical control • ensures that your manufacturing process can meet customer requirements and quantities.
Why use APQP? The APQP assists with: • Identify and analyse potential failure modes • Using failure modes and effects analysis (FMEA) to solve potential failures. • Verification and validation of design process and product • Testing to confirm that the design output meets design input requirements.
Why use APQP? The APQP assists with: • Conduct reviews • Formal reviews are carried out during the development of a product to meet the specified requirements. • Control special or critical characteristics • Special/critical characteristics are identified. • The process is assessed to make sure it can meet the requirements. • A control plan is prepared to indicate how this will be achieved.
Phases of APQP The advanced quality planning process consists of: • five phases • five major activities • ongoing feedback • corrective actions.
Phase one of APQP Plan define program includes: • Define goals as per customer needs • Reliability and quality goals • Preliminary bill of materials • Preliminary process flow • Preliminary listing of special product and process characteristics • Product assurance plan.
Phase two of APQP Product design and development verification includes: • Design FMEA • Process FMEA • Design verification • Design reviews • Prototype build • Engineering drawings • Engineering specifications • Material specifications • Drawing specification changes • New equipment, tooling and facilities requirements • Special product and process characteristics • Prototype control plan • Gauges and testing equipment requirements.
Phase three of APQP Process design and development verification includes: • Packaging standards • Product and quality process systems review • Process flow chart • Floor plan layout • Characteristics matrix • Process FMEA • Pre launch control plan • Process instructions • Measurements systems analysis plan • Preliminary process capability study plan • Packaging specifications.
Phase four of APQP Product and process validation includes: • Production trial run • Measurement systems evaluation • Preliminary process capability study • Production part approval • Production validation testing • Packaging evaluation • Production control plan • Quality planning sign-off.
Understanding the customer need Scope of work Before a business can take on a new manufacturing project a Scope of works is provided by the customer. The customer needs are translated into product characteristics and requirements.
Understanding the customer need The Scope of work outlines all requirements and specifications for the manufacture of a specific part, for example: • Weld specifications • Production rates • Compliance • Special characteristics of part • Critical characteristics of part.
Customer specifications The customer provides specifications as documents and drawings. Identified on the engineering drawings are: • Special characteristics (SC) • This refers to ‘fit up points’ on the part, where it needs to align with another component. • Critical characteristics (CC) • This refers to design aspects being critical to the performance of a part. ie. Thread size.
Assessing your capabilities It is essential to assess if your current manufacturing capabilities can meet the needs of the customer before accepting the work. Can your current equipment: • produce parts to the given specifications? • produce the required number of parts per hour? There can be severe financial penalties and future business opportunities can be jeopardised if contract requirements are not met.
Supply capabilities In most circumstances the supplier has full liability for the integrity of their product. It is their responsibility to deliver 100% reliable product. • In the past receiving inspections were carried out on supplied parts as audits, random checks and physical quantities, however this is no longer common to all businesses. • QA representatives from the client can be sent out to audit/confirm the capability of your business. • Poke yoke quality controls may be used as part of the process to identify supply faults, using the PFMEA as a reference document.
Process capabilities Is the product design within your organisations process capabilities? Do you have the right equipment? Can you manufacture the quantities required? Statistical process controls (SPC) are an effective way of monitoring a process through the use of control charts to detect and correct before any incorrect product is made.
Statistical process control • Statistical process control moves business to Six Sigma levels of quality, so that unexpected failure is confined to six standard deviations on the normal distribution curve. • Traditional statistical process controls in manufacturing operations use random sampling and testing for checking quality. • Variation of critical tolerances are tracked, and manufacturing processes are corrected before bad parts can be produced.
Statistical process control SPC is generally used to assess machine/robot applications. The statistical measurements used in SPC are: • Process capability (Cp) • the ability of a process to produce parts within specified limits. • Process capability index (Cpk) • the adjustment of Cp for the effect of a non centred distribution. ie. How close are you to the target? • Process performance (Pp) • Estimated variation within the specified limits. • Process performance index (Ppk) • estimated variation that will occur over time.
Statistical process control Example: Spot welding Cp is when you have a tight grouping of welds. They are within the target area, but need adjustment to be centred. Cpk is the adjustment of Cp for the effect of non centred distribution of weld spots.
Statistical process control Calculation for CPK is generally done with software programs. For example Minitab will work out: • Pp • Ppk • Cp • Cpk • Plot all distribution curves.
Statistical process control Ppk A control chart consists of the following: • The points are the average measurements taken of a quality characteristic versus time • The centre line represents the nominal specification • Upper and lower control limits indicate the acceptable tolerance deviation that still meet client requirements.
Quality reporting Quality reporting includes: • Parts per million (PPM) • Quality problem reporting (QPR) • Eight disciplines to problem solving (8D) • Customer fill rates (Delivery performance) • Equipment performance.
Quality reporting Parts per million (PPM) Definition Reporting or forecasting the potential number of defects in a million manufactured parts Example: 1000000 parts = 2 fail = 2 PPM 100000 parts = 2 fail = 200 PPM 10000 parts = 2 fail = 2000 PPM 1000 parts = 2 fail = 20000 PPM
Quality reporting Calculating PPM 200 parts per day x 5 days = 1000 parts per week = 4000 parts per month 1000000PPM 4000 = 250 x 3 (rejects) = 750 PPM for month Forecast 750 PPM x 12 months = 9000 PPM for the year. Note: The industry expects 100 PPM per year or less.
Quality problem reporting (QPR) This is usually a fault identified by the customer. A QPR is then issued in relation to the stated problem, which requires an investigation and response in both short term and long term. Containment of product is a short term solution, until long term corrective actions can be put in place. Long term corrective actions should include Poke Yokes and PFMEA.
Quality problem reporting (QPR) Eight disciplines to problem solving (8D) • D1: Assemble a cross-functional team of experts • D2: Define the Problem. • D3: Implement and verify Interim Containment Actions (ICAs) as needed. Also known as Temporary Fixes. • D4: Identify and Verify Root Cause • D5: Choose and verify Permanent Corrective Actions (PCAs). Preventive Actions are also chosen. • D6: Implement and validate PCAs • D7: Prevent recurrence of the Problem/Root Cause • D8: Recognize the efforts of the Team
Quality problem reporting (QPR) Customer fill rates (Delivery performance) • Want to determine that you are being sent the correct quantities at the accepted quality level. ie. Dimensional or burr free. • Product must be packaged correctly to avoid damaging parts. Type of packaging as per specification. • May specify special conditions. ie rust protection. • On time delivery/delivery slot within the agreed frequency.
Quality problem reporting (QPR) Equipment performance • General maintenance issues ie. Worn spindle bearings, • Under performing fixtures ie. Clamping fault • Incorrect cutting lubricants ie. Incorrectly mixed, low pressure • Tooling ie. worn.
Problem solving tools Fishbone diagram The cause and effect diagram is used to explore all the potential or real causes that result in a single effect. Causes are arranged according to their level of importance or detail, showing the relationships and importance of events.
Fishbone diagram Cause and effect diagrams are often divided into four major categories. While these categories can be anything, the following are recommended for manufacturing: • Manpower • Methods • Materials • machinery.
Fishbone diagram • Put in full diagram
Production part approval process Suppliers are required to go through a Production part approval process (PPAP). Vehicle manufacturers are required to obtain approval whenever a new or modified component is introduced to production, or the manufacturing process is changed. • PSW parts submission warrant is a one page summarised document for PPAP evidence.
Production part approval process Obtaining approval requires the supplier to provide sample parts and documentary evidence showing that: • The clients requirements have been understood • The product supplied meets those requirements • The process is capable of producing conforming product • The production control plan and quality management system will prevent non-conforming product reaching the client or compromising the safety and reliability of finished vehicles.
Summary • Uses for APQP • Understanding capability • Using problem solving tools • PPM calculations • SPC • Using fishbone diagrams • PPAP/PSW