Download
1 / 32
320 likes | 325 Vues
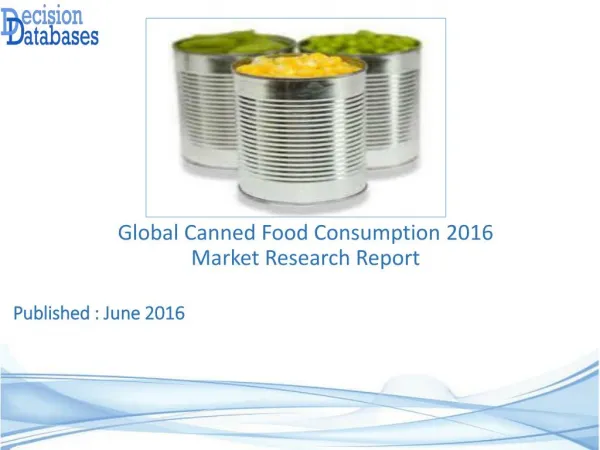
This report provides a comprehensive overview of the U.S. canned fruit industry, including trends in production, delivery, pricing, and imports/exports. It highlights key players such as Del Monte Foods, Seneca Foods, and Pacific Coast Producers. The report emphasizes the nutritional benefits and affordability of canned fruit and its availability year-round.

E N D
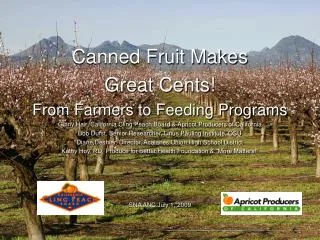
A U.S. Industry Report 11th World Canned Deciduous Fruit Conference May 30 – June 2, 2012 Litochoro, Greece
U. S. Canned Fruit Processors Peaches Del Monte Foods Seneca Foods Pacific Coast Producers Pears Del Monte Foods Seneca Foods Pacific Coast Producers Northwest Packing Company Independent Food Processors Truitt Bros. Apricots Del Monte Foods Seneca Foods Pacific Coast Producers
Consolidating U. S. Processed Peach Industry in California • 1952 – 42 CANNERS • 1972 – 17 CANNERS • 2012 – 3 CANNERS 2 FREEZERS
California Cling PeachBearing Hectare Trends2002 - 2012 Thousands of Hectares
Cling Peach Hectares Pulled vs. Hectares Planted2006 - 2012 Hectares Total Hectares Pulled: 6,185 Total Hectares Planted: 3,141
Cling Peach Delivery TrendsTotal Tons to All Processors2000 – 2012 Thousands of Metric Tons Est.
California Cling Peach Production TrendsYield Per Bearing Hectare1960 – 2011 Metric Tons / Bearing Hectare 60’s Avg.29.68 70’s Avg.32.68 80’s Avg.37.95 90’s Avg.39.68 00’s Avg.38.27 45.1 43.0 42.0 42.4 41.7 41.7 39.2 41.0 41.2 39.28 38.7 37.4 37.2 34.4 37.1 34.3 36.0 34.0 31.1 31.2 34.1 30.1 29.8 29.3 10 YearAverageYield 28.8 27.4 26.5 24.5 2011
California Cling PeachPrice Trends 2000 – 2011 Price/Metric Ton *Average Value Ton – Converted to Same Basis as 1992 – 2003
California Cling PeachPack Trends 2000 – 2011 Millions of 24/2-1/2 Basic Cases
California Fruit Cocktail & Mixed Fruit Pack Trends2000 – 2011 24/2 ½ Basic Cases (Millions)
U.S. Canned Peach Import Trends2000 - 2011 Thousands of Cases
U. S. Canned Peach Imports2010 – 2011 Marketing Year Marketing Year Total: 3,334,422 Cases (+ 7%)
U. S. Canned Peach Export Trends2000 - 2011 Thousands of Cases
U. S. Canned Peach Exports2010 – 2011 Marketing Year Marketing Year Total: 1,029,663 Cases (+ 28%)
West Coast Bartlett PearsBearing Hectare Trends2002 - 2011 Bearing Hectares (000’s) 12.60 12.20 12.00 11.90 11.90 11.09 11.01 10.61 9.50 9.40
West Coast Pear Delivery TrendsVolume Utilized for Canning Thousands of Metric Tons 274 257 252 253 248 246 241 237 218 213
Utilization of West Coast Canned Pear Tonnage Total 2011 Deliveries: 274,000 MetricTons
Northwest Canning Pear Price TrendsBartlett Pears – No. 1’s2002 - 2011 $ per Metric Ton
West Coast Canned Bartlett Pear Pack Trends2002 - 2011 24 / 2½ Basic Cases (Millions)
California Canning Pear Price TrendsBartlett Pears – No. 1’s2002 - 2011 $ per MetricTon
West Coast Canned Bartlett Pear Sales Trends2002 - 2011 24 / 2½ Basic Cases (Millions)
U. S. Canned Pear Imports2010/11 Marketing Year Marketing Year Total: 1,160,828 Cases (- 3%)
California ApricotsBearing Hectare Trends2002 - 2011 Bearing Hectares
California Canned Apricot Pack Trends2002 - 2011 24 / 2 ½ Basic Cases (Millions)
California Canned Apricot Price Trends2002 - 2011 $ per Metric Ton
U. S. Canned Apricot Imports2010/11 Marketing Year Marketing Year Total: 47,479 Cases (+35%)
“Canned and frozen fruits not only offer great nutrition, but they are inexpensive and convenient ways to make sure that we maximize the variety and number of fruit servings needed to protect our health.” -- American Institute for Cancer Research • Canned fruit offers great nutrition and is less expensive on a cost per serving basis than fresh fruit. Shelf-stable canned fruit is available year-round and arrives ready-to-eat and packaged in appropriate portion sizes. • Several university studies confirm that canned fruit is nutritionally comparable to fresh fruit.
The California peach industry consists of many generations-old family farms. Our average farmer grows 20 hectares of peaches. Our peaches are picked at the peak of ripeness and generally packed within 24 hours of picking.
CaliforniaCanning Peach Association “A Home and A Price” Representing California Growers Since 1922