Download
1 / 49
490 likes | 596 Vues
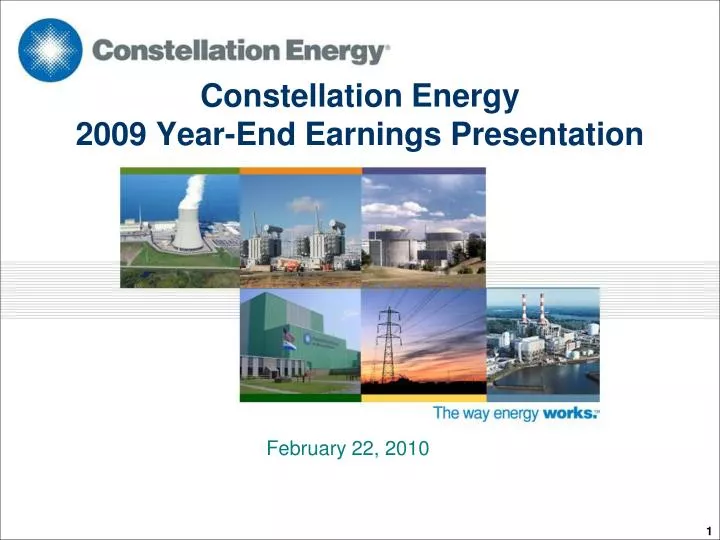
Constellation Energy 2009 Year-End Earnings Presentation. February 22, 2010. Forward Looking Statements Disclosure.

E N D
Constellation Energy2009 Year-End Earnings Presentation February 22, 2010
Forward Looking Statements Disclosure Certain statements made in this presentation are forward-looking statements and may contain words such as “believes,” “anticipates,” “expects,” “intends,” “plans,” and other similar words. We also disclose non-historical information that represents management’s expectations, which are based on numerous assumptions. These statements are not guarantees of future performance and are subject to risks and uncertainties that could cause actual results to be materially different from projected results. These risks include, but are not limited to: the timing and extent of changes in commodity prices and volatilities for energy and energy-related products including coal, natural gas, oil, electricity, nuclear fueland emissions allowances and the impact of such changes on our liquidity requirements; the liquidity and competitiveness of wholesale and retail markets for energy commodities; the conditions of the capital markets, interest rates, foreign exchange rates, availability of credit facilities to support business requirements, liquidity and general economic conditions, as well as Constellation Energy’s and BGE’s ability to maintain their current credit ratings; the effectiveness of Constellation Energy’s and BGE’s risk management policies and procedures and the ability and willingness of our counterparties to satisfy their financial and performance commitments; losses on the sale or write-down of assets due to impairment events or changes in management intent with regard to either holding or selling certain assets; the ability to successfully identify, finance and complete acquisitions and sales of businesses and assets, including generating facilities, and new nuclear generation development projects; the effect of weather and general economic and business conditions on energy supply, demand, and prices, and customers' and counterparties' ability to perform their obligations or make payments; the ability to attract and retain customers in our customer supply activities and to adequately forecast their energy usage; the timing and extent of deregulation of, and competition in, the energy markets, and the rules and regulations adopted in those markets; regulatory or legislative developments federally, in Maryland, or in other states that affect energy regulation, the price of energy, transmission or distribution rates and revenues, demand for energy, or that would increase costs, including costs related to safety or environmental compliance; the ability of our regulated and non-regulated businesses to comply with complex and/or changing market rules and regulations; the ability of BGE to recover all its costs associated with providing customers service; operational factors affecting the operations of our generating facilities and BGE’s transmission and distribution facilities, including weather-related damages, unscheduled outages or repairs, unanticipated changes in fuel costs or availability, unavailability of coal or gas transportation or electric transmission services, workforce issues, terrorism, liabilities associated with catastrophic events, and other events beyond our control; the impact of industry consolidation; the impact of increased energy conservation and use of renewable energy; the actual outcome of uncertainties associated with assumptions and estimates requiring judgment when managing our business, applying critical accounting policies and preparing financial statements, including factors that are estimatedin determining the fair value of energy contracts, such as the ability to obtain market prices and in the absence of verifiable market prices, the appropriateness of models and model inputs (including, but not limited toestimated contractual load obligations, unit availability, forward commodity prices, interest rates, correlation and volatility factors); changes in accounting principles or practices; and cost and other effects of legal and administrative proceedings that may not be covered by insurance, including environmental liabilities. Given these uncertainties, you should not place undue reliance on these forward-looking statements. Please see our periodic reports filed with the SEC for more information on these factors. These forward-looking statements represent estimates and assumptions only as of the date of this presentation, and no duty is undertaken to update them to reflect new information, events or circumstances. 2
Use of Non-GAAP Financial Measures Constellation Energy presents adjusted earnings per share (adjusted EPS) in addition to its reported earnings per share in accordance with generally accepted accounting principles (reported GAAP EPS). Adjusted EPS is a non-GAAP financial measure that differs from reported GAAP EPS because it excludes the cumulative effects of changes in accounting principles, discontinued operations, special items (which we define as significant items that are not related to our ongoing, underlying business or which distort comparability of results) included in operations, the impact of certain economic, non-qualifying hedges and synfuel earnings. The mark-to-market impact of these hedges has been significant to reported results, but economically neutral to the company in that offsetting gains or losses on underlying accrual positions will be recognized in the future. Synfuel earnings have been excluded due to the potential for oil-price volatility to result in a difficult-to-forecast phase-out of tax credits. Effective in 2009, we are no longer adjusting our reported GAAP EPS for either synfuel earnings, due to the expiration of the tax credit, or non-qualifying hedges, which were related to activities conducted by our recently divested operations. We present adjusted EPS because we believe that it is appropriate for investors to consider results excluding these items in addition to our results in accordance with GAAP. We believe such a measure provides a picture of our results that is more comparable among periods since it excludes the impact of items such as impairment losses, workforce reduction costs or gains and losses on the sale of assets, which may recur occasionally, but tend to be irregular as to timing, thereby distorting comparisons between periods. However, investors should note that this non-GAAP measure involves judgment by management (in particular, judgment as to what is classified as a special item to be excluded from adjusted earnings). This non-GAAP measure is also used to evaluate management’s performance and for compensation purposes. Constellation Energy also provides its earnings guidance in terms of adjusted EPS. Constellation Energy is unable to reconcile its guidance to GAAP earnings per share because we do not predict the future impact of special items due to the difficulty of doing so. In the past, the impact of special items has been material to our operating results computed in accordance with GAAP. Our earnings guidance excludes results of the UniStar joint venture and any impact from the operations and divestiture of our international commodities , Houston-based gas trading , international uranium marketing and west power trading operations, in addition to any other special items that may occur. We note that non-GAAP measures should not be viewed as a substitute to GAAP information. A reconciliation of non-GAAP information to GAAP information is included either on the slide where the information appears or on one of the slides in the Non-GAAP Measures section provided at the end of the presentation, along with additional information on why and how Constellation Energy uses this information. Please see the Summary of Non-GAAP Measures to find the appropriate GAAP reconciliation and related slide(s). These slides are only intended to be reviewed in conjunction with the oral presentation to which they relate. 3 3
2009 Highlights Reported adjusted 2009 earnings of $3.36 per share, in-line with guidance range Completed all strategic initiatives outlined in year-end 2008 earnings call Closed EDF transaction and sale of non-core businesses Improved available liquidity and de-levered capital structure Achieved stable, investment grade credit ratings Strong operating performances by core businesses Set record capacity factors across the nuclear fleet Significantly completed key non-nuclear generation projects Realized strong Retail and Wholesale customer margins Established efficiency projects and developed a Smart Grid pilot program aimed at reducing customer usage and bills Constellation successfully completed its announced initiatives ahead of schedule and at less cost, while also delivering solid financial results in 2009 4 See Appendix
Market Update Power prices and dark spreads deteriorated in 2009, but appeared to stabilize by year-end Power demand in 2009 declined in most regions (2) Constellation managed significant challenges in 2009 through active risk and portfolio management (1) Emissions include SO2, NOx and RGGI CO2 (2) PJM Mid-Atlantic
Baltimore Gas & Electric (BGE) Overview • Exceeded all key operational goals in 2009 • Increased BGE financial flexibility • Expanded existing credit facility from $400 million to $575 million • Entered into a new, secured bond indenture • Focused on reducing customer usage and bills • Continued capital investment in Smart Energy Savers Program • Increased demand response capacity • Full implementation of energy efficiency programs • Key regulatory initiatives underway • Filed Smart Grid proposal with Maryland PSC • Awarded $200 million stimulus grant for full deployment of Smart Grid program • Completed all ring-fencing measures BGE expects to earn reasonable returns on investments in reliability, load growth, energy efficiency and demand response
Generation Overview • Strong operating performance with 90% reliability in 2009 • Completion of major environmental projects • Brandon Shores Unit 1 scrubber on-time and within budget • Environmental projects at Wagner and Crane coal facilities • In-compliance with Maryland Healthy Air Act • Substantially completed construction of a 740 MW combined cycle plant in Alabama • Among the most productive fleets in the country • 95.2% fleet capability factor in 2009 – highest among all U.S. nuclear fleets • Set numerous plant and fleet records • Calvert Cliffs Unit 2 set a world record for operating continuously for 692 days • Completed refueling outages at Nine Mile Point and Ginna in approximately 20 days • Closed nuclear joint venture with EDF • Constellation will purchase approximately 90% of the uncommitted output from the JV Non-Nuclear Generation Nuclear Generation During 2009, Constellation’s existing generation fleet set plant records and completed a number of environmental and construction projects on-time and within budget
Customer Supply Overview • Right-sized and reduced costs • Scaled business to size consistent with Constellation’s balance sheet • Expect to serve over 30,000 customers and approximately 140 TWHs of load in 2010 • Reduced collateral needs • Continued to secure high unit margins on new contracts signed in 2009 • Average new business Retail margins were over $7.50/MWh • Average new business Wholesale margins were approximately $3/MWh • Expect strong unit margins going forward • Sustainable Retail Power margins of $5 - $7/MWh • Sustainable Wholesale Power margins of $2 - $4/MWh • Efforts to streamline the business and reduce operating costs continue Building a scalable Customer Supply platform to support business activities in a disciplined, profitable and capital efficient manner
Investment Thesis • Positioned to invest in physical generation assets at attractive returns • Significant excess cash balances and strong balance sheet • Unique merchant business model • Low commodity price environment and depressed asset values • Leading retail and wholesale customer supply platforms • Reduces cash and earnings volatility during periods of the commodity cycle • Strengthen existing customer relationships by providing value-added products and services • Opportunities for increased earnings profile at BGE • Investment opportunities related to improving system reliability and efficiency • Expect additional capital spending at BGE to increase regulated rate base • Participating in the development of a new nuclear unit at Calvert Cliffs through the UniStar partnership • Focus on further reducing the operating costs and improving the capital efficiency of the businesses Going forward, Constellation is focused on an asset-backed investment strategy and the further reduction of operating costs in its businesses
2009 Adjusted Earnings Per Share (1) Excludes special items, and certain economic, non-qualifying hedges See Appendix 11
Net Available Liquidity • Excludes $0.5B of contractual facility capacity under commodity linked facility, under which the availability fluctuates with commodity price movements • Includes letters of credit posted under uncommitted facilities • Reserved cash comprised of net tax liability from EDF transaction ($0.7B) and cash to be used to fund voluntary debt retirement in Q1 2010 ($0.6B) • Includes $0.9 billion of net available liquidity at BGE as of year-end 2009. BGE was ring-fenced in February 2010 12
Debt Maturity Profile • $550M CEG 4.55% Notes due 2015 • $700M CEG 7.60% Notes due 2032 • The total long-term debt includes the current portion of the long-term debt • Note: Numbers may not add due to rounding. 13
Balance Sheet Metrics (1) (2) (2) (2) (2) • Significantly de-levered Merchant balance sheet in 2009 and 2010 • Strong near-term investment grade credit metrics, with Merchant FFO/Debt ratios at 38% Represents BGE’s investment in CEG cash pool at December 31, 2009. BGE exited the CEG cash pool in January 2010. Based on our understanding of the S&P methodology and excluding special items. Note: Numbers are subject to change pending filling of 10K, and may not sum due to rounding See Appendix 14
2010 & Beyond EPS Forecast 2010 and 2011 guidance range reflect current forward pricing curve and do not reflect the reinvestment of excess cash 2011 will benefit from the continued roll-off of existing lower margin contracts and increased earnings contribution from BGE ($ per share) (1) Data excludes Special Items, including the amortization of CENG basis differential, and UniStar earnings (2)Assumed MWhs exposed to Dark Spread movements equals the forecasted MWhs for coal-burning fleet See Appendix 15
2009 Adjusted Earnings Recap Note: Numbers may not add due to rounding See Appendix
BGE – 2008 and 2009 Income Statement (1) Adjusted earnings exclude special items Note: Numbers may not sum due to rounding See Appendix 19
Merchant – 2008 and 2009 Income Statement Adjusted earnings exclude special items Note: Numbers may not sum due to rounding See Appendix 20
2009 Cash Flow Note: Numbers are subject to change pending filing of 10-K (1) Items are not allocated to the business segments because they are managed for the company as a whole 21
Capital Spending – BGE • Key drivers of capital expenditures: • Electric and gas infrastructure spending for reliability • Electric transmission investments for reliability • Smart Energy SaversSM initiatives including energy efficiency, PeakRewardsSM, and advanced metering
Capital Spending – Merchant & Other Memo: Nuclear JV Capex 62 403 454 • Key drivers of capital expenditures: • Environmental spending decline is driven by completion of scrubber projects in 2009 and Baltimore fly ash site purchase in 2010. • Growth spending includes Hillabee Power plant in 2009, Criterion wind project in 2010, CEPS solar projects, and upstream gas production 2009 Maintenance capital spending includes $359M of Nuclear capex prior to closure of JV Growth Spending excludes equity contributions to the UniStar JV
Bank Facilities Note: Numbers may not sum due to rounding
Projected 2010-2011 Net Available Liquidity Note: BGE cash at December 2009 represents entity's investment in CEG’s cashpool. BGE exited cashpool in January 2010. 25
CENG Earnings Outlook (1) Includes support costs, property taxes and other costs (2) Represents CEG’s 50% ownership stake in nuclear joint venture with EDF Note: All forward curves as of 12/15/09. Numbers may not add due to rounding 27
Non-Nuclear Generation Earnings Outlook (1) Includes equity earnings component of IPP/QF not normally included in GM (2)Includes allocated headquarters costs, property taxes and other costs (3) Includes output from CENG PPA Note: All forward curves as of 12/15/09. Numbers may not add due to rounding 28
Forward Market and Average Hedged Prices • BGE zone is historically a 10%-20% premium to PJM WHUB pricing; Ginna/NMP zones are historically a 5%-15% premium to NY WHUB pricing • NY Capacity prices not disclosed in 2011 – 2013 as prices clear through a monthly auction • Includes current fixed priced portion of CENG PPA and existing NY PPAs/RSA • Coal prices ($/ton) do not include transportation costs of approximately $20 - $30 per ton 29
Generation Statistics Includes Keystone and Conemaugh Includes Safe Harbor; Criterion; Panther Creek; Colver; Ace Trona; Jasmin; Mammoth Lakes; Chinese Station; Fresno; Malacha; Poso; Rocklin; Sunnyside 30
Merchant Activities (Generation and Customer Supply) New York Owned: 8.8 Contracted: 2.8 West Owned: 1.6 Contracted: 0.3 PJM (3) Owned: 24.2 Contracted: 8.0 Nuclear Plants Fossil Plants Renewable Plants Generation (TWhs) Customer Supply (TWhs) MISO Owned: 0.0 Contracted: 0.6 Nepool Owned: 0.0Contracted: 1.9 SERC Owned: 1.3Contracted: 12.8 ERCOT Owned: 0.0Contracted: 3.1 (1) QFs in West and East regions (2) Existing PPAs on NY plants (3) Criterion Wind Project currently undergoing pre-construction activities, no MWh’s assumed in 2010 (4)Wholesale excludes Mid-Marketing 6.0TWh and 14.6TWh for 2009 and 2010 respectively 32
Customer Supply Volume (Bcf) Volume (TWh) Retail Power Retail Gas Gas GM/Dth (2),(3) Electric GM/MWh (1) Backlog as of 12/31/09 Flow Volumes Gross Margin $ millions Backlog represents 78% and 43% of total Gross Margin we expect to realize in 2010 and 2011, respectively (1) Gross of Collateral Costs (2) Mark-to-market timing impact has been excluded from these numbers (3) Gas unit margins were normalized in the first and second quarters of 2009 (4) Wholesale Power includes Mid-Marketing 33
Economic Value at Risk (EVaR) Economic Value at Risk (1) $179MM Reduction due to gas sales to hedge generation length and 10-12% decline in Unit VaR(2) Reduction due to inclusion of only Proved Producing portion of Upstream Portfolio, consistent with our business plan Reduction due to sale of several Upstream gas assets and 12-15% decline In Unit VaR(2) Reduction due to close of the EDF JV transaction $ in Millions $73MM 30-Sep 31-Oct 30-Nov 31-Dec 31-Jan 28-Feb 31-Mar 30-Apr 31-May 30-Jun 31-Jul 31-Aug 30-Sep 31-Oct 31-Dec 30-Nov EVaR has declined 17% since the end of Q309, driven by the close of EDF JV transaction. Since last year, EVaR has declined 46% due to an overall decrease in unit VaR and the successful completion of business transactions. (1) Economic Value at Risk (EVaR) represents the maximum one day loss of economic value for our total portfolio assuming no new trades are executed. It is estimated as a 1-in-20 day event, or with a 95% Confidence Interval. All generation, customer supply, commodities and businesses for sale portfolio positions are included in the Economic Value at Risk calculation. (2) Unit VaR is the Value at Risk per unit of the respective commodity and represents the cost of VaR 34
Wholesale Portfolio Credit Quality As of December 31, 2009 Credit Exposure by Sector (Net of Collateral) Portfolio Credit Quality Exposure $ in Millions During Q4’09, total wholesale exposure increased, largely due to the addition of exposure to Constellation Energy Nuclear Group. Non-investment grade counterparties now account for less than 13% of total exposure. Since last year, wholesale exposure has decreased 38%. Note: Based on internal credit ratings Subject to change pending filing of 2009 Form 10-K 35
Gross Derivatives – Assets $51.9B $50.6B $40.2B $36.3B $27.3B $20.3B 2008 2009 • Changes in the Gross Derivative Balance is only impacted by two forces: • Commodity price volatility, which is market-based and not controlled by CEG • Change in Number of Contracts Note: Subject to change pending filing of 2009 Form 10-K 36
Mark-to-Market Derivative Assets Note: Subject to change pending filing of 2009 Form 10-K 37
Adjusted EPS 2009, 2008 and Quarterly – Consolidated We exclude special items and certain economic, non-qualifying hedges because we believe that it is appropriate for investors to consider results excluding these items, in addition to our results in accordance with GAAP. We have also adjusted earnings to exclude synfuel results due to the potential volatility and phase-out of the tax credits. We believe such a measure provides a picture of our results that is comparable among periods since it excludes the impact of items, which may recur occasionally, but tend to be irregular as to timing and magnitude, thereby distorting comparisons between periods. However, investors should note that this non-GAAP measure involves judgment by management (in particular, judgments as to what is or is not classified as a special item). We also use this measure to evaluate performance and for compensation purposes. Effective in 2009, we are no longer adjusting our Reported GAAP EPS for synfuel earnings, due to the expiration of the tax credit, and non-qualifying hedges, which were related to activities conducted by our recently divested operations.
Adjusted EPS 2009, 2008 and Quarterly – Merchant We exclude special items and certain economic, non-qualifying hedges because we believe that it is appropriate for investors to consider results excluding these items, in addition to our results in accordance with GAAP. We have also adjusted earnings to exclude synfuel results due to the potential volatility and phase-out of the tax credits. We believe such a measure provides a picture of our results that is comparable among periods since it excludes the impact of items, which may recur occasionally, but tend to be irregular as to timing and magnitude, thereby distorting comparisons between periods. However, investors should note that this non-GAAP measure involves judgment by management (in particular, judgments as to what is or is not classified as a special item). We also use this measure to evaluate performance and for compensation purposes. Effective in 2009, we are no longer adjusting our Reported GAAP EPS for synfuel earnings, due to the expiration of the tax credit, and non-qualifying hedges, which were related to activities conducted by our recently divested operations.
Adjusted EPS 2009, 2008 and Quarterly – BGE We exclude special items and certain economic, non-qualifying hedges because we believe that it is appropriate for investors to consider results excluding these items, in addition to our results in accordance with GAAP. We have also adjusted earnings to exclude synfuel results due to the potential volatility and phase-out of the tax credits. We believe such a measure provides a picture of our results that is comparable among periods since it excludes the impact of items, which may recur occasionally, but tend to be irregular as to timing and magnitude, thereby distorting comparisons between periods. However, investors should note that this non-GAAP measure involves judgment by management (in particular, judgments as to what is or is not classified as a special item). We also use this measure to evaluate performance and for compensation purposes. Effective in 2009, we are no longer adjusting our Reported GAAP EPS for synfuel earnings, due to the expiration of the tax credit, and non-qualifying hedges, which were related to activities conducted by our recently divested operations.
Adjusted EPS 2009, 2008 and Quarterly – ONR We exclude special items and certain economic, non-qualifying hedges because we believe that it is appropriate for investors to consider results excluding these items, in addition to our results in accordance with GAAP. We have also adjusted earnings to exclude synfuel results due to the potential volatility and phase-out of the tax credits. We believe such a measure provides a picture of our results that is comparable among periods since it excludes the impact of items, which may recur occasionally, but tend to be irregular as to timing and magnitude, thereby distorting comparisons between periods. However, investors should note that this non-GAAP measure involves judgment by management (in particular, judgments as to what is or is not classified as a special item). We also use this measure to evaluate performance and for compensation purposes. Effective in 2009, we are no longer adjusting our Reported GAAP EPS for synfuel earnings, due to the expiration of the tax credit, and non-qualifying hedges, which were related to activities conducted by our recently divested operations.
2009 BGE Gross Margin We utilize the non-GAAP financial measure of Gross Margin to highlight the relationship between the costs of and prices for energy and to highlight the primary driver of earnings at our Regulated Utility. We also make certain adjustments to items below gross margin through net income including EBIT. We believe these non-GAAP measures help investors to better understand the changes in the level of our BGE operating results from period to period.
2008 BGE Gross Margin We utilize the non-GAAP financial measure of Gross Margin to highlight the relationship between the costs of and prices for energy and to highlight the primary driver of earnings at our Regulated Utility. We also make certain adjustments to items below gross margin through net income including EBIT. We believe these non-GAAP measures help investors to better understand the changes in the level of our BGE operating results from period to period.
2009 Merchant Gross Margin and Below Gross Margin We utilize the non-GAAP financial measure of Gross Margin to highlight the relationship between the costs of and prices for energy in our Merchant Energy business categories (i.e., Generation, Customer Supply, and Global Commodities). We also make certain adjustments to items below gross margin through net income including EBIT. We believe these non-GAAP measures help investors to better understand the changes in the level of our Merchant Energy operating results from period to period.
2008 Merchant Gross Margin and Below Gross Margin We utilize the non-GAAP financial measure of Gross Margin to highlight the relationship between the costs of and prices for energy in our Merchant Energy business categories (i.e., Generation, Customer Supply, and Global Commodities). We also make certain adjustments to items below gross margin through net income including EBIT. We believe these non-GAAP measures help investors to better understand the changes in the level of our Merchant Energy operating results from period to period.
Adjusted Debt, Equity, and Capitalization We provide the non-GAAP measures of Adjusted Debt, Adjusted Equity, and Adjusted Capitalization as management believes these measures provide investors useful information on our leverage because it is consistent with the evaluation performed by rating agencies.
Funds From Operations The non-GAAP financial measure of Funds from Operations (FFO) is a non-GAAP measure that approximates recurring cash flows from operations exclusive of all non-cash items and working capital. We utilize this non-GAAP measure as it is helpful in understanding our recurring operating cash performance as earnings generally include large non-cash items.