Download
1 / 16
160 likes | 372 Vues
Low Temperature Characteristics of ZnO Photoluminescence Spectra. Matthew Xia. Columbia University. Advisor: Dr. Karl Johnston. Background.

E N D
Low Temperature Characteristics of ZnO Photoluminescence Spectra Matthew Xia Columbia University Advisor: Dr. Karl Johnston
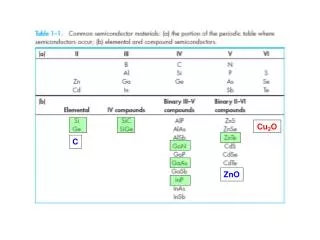
Background • Semiconductorsare materials that are insulating at absolute zero temperature, but are conducting as temperature is raised or impurities are added (i.e., Si, Diamond, GaAs.) • N-type semiconductor, negative charge carrier (i.e., Si doped with As, the donor). • P-type semiconductor, positive charge carrier (i.e., Si doped with B, the acceptor). Si - Si Si Si Si Si As+ B- Si Si
Photoluminescence If the material is excited by an optical beam at an greater than the band gap, electron-hole pairs called the exciton created. • Free excitons (FE or X), denoted by x. • Bound excitons (BE, DX,AX), denoted by Ix. • Electron to acceptor. • Hole to donor. • Donor to acceptor. • Other internal impurity of defect transitions. Henry et al, Hyperfine Interactions (2000)
Some Properties of ZnO • Wide band gap (3.3 eV) with a high exciton binding energy (60 meV, in comparison to 24 meV for GaN), a bright emitter. Applications in room temperature LDs and LEDs. • Can easily grow very high quality films. • As of yet, only n-type materials could be consistently produced. Attempts are made to grow p-type ZnO using N or Li. • Impurities include In, Ga, H, Al.
Setup I: Impurity Implantation at ISOLDE • 1.4 GeV proton beam hits target, creating radionuclides. • The beam goes through a series of magnets, separating out the desired isotopes. • Beam enters high energy platform, where it is accelerated to 260 keV and implanted. • Greater than 600 isotopes of 60 elements could be created at ISOLDE. Experiments carried out at ISOLDE, CERN (Isotope Separation Online) Hyperfine Interactions: 129 (2000)
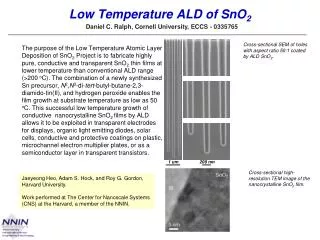
Setup II: APRIL (Apparatus for Photoluminscence Investigations with Radioactive Isotopes off-Line) • A HeCd laser operated at 325 nm is used to excite the sample at an energy above the band gap. • The sample is immersed in liquid He, to keep the surrounding temperature around 2K. • The PL signal enters the monochromator, and a CCD camera cooled by liquid N is used to convert the signal into electronic signal. • The data is then transferred to a computer for analysis.
Undoped ZnO on Rubicon • The most prominent peaks are at the far left, representing the shallow bound excitons. • They are preceded by three smaller FE lines, conventionally denoted by A, B, and C. • The red is occupied by a distinctive broad band, called the Green band, due to maybe Cu impurities, or Zn or O vacancies.
Bound Excitons and Two Electron Satellites • Through diffusion experiments, they have been attributed to shallow impurities such as H(I4), Al(I6), Ga(I8), and In(I9). • Between the BE and TES lines is the • DBX peak. Using catholuminescence techniques, it has been attributed to structural defect recombination sites.
Some Properties of 73Ga • A group III element, proven good n-type dopants for ZnO. • 1.26 Ǻ covalent radius, similar to the 1.31 Ǻ for Zn. • Neutron rich, decays via beta emission: • Lifetime of 4.86 hours, with a decay energy of 1.59 MeV. • Dopant concentrations are given by: where λ = ln(2)/t1/2 .
73Ga Doped ZnO • Ix line at 3.363 eV decays exponentially. • Iy line at 3.364 eV remains the same. • Phonon line at 3.337 eV used to normalize all peaks. • Exponential fit gives a half-life of 5.5 hours, with 17.5% uncertainty.
73Ga Doped Sample at Lower Energies • DD line at 3.326 eV grows as time progresses. • Exponential fit of normalized intensity gives a half-life of 5.3 hours with 27% uncertainty. • Same line also observed in stable Zn implanted samples at a slightly different energy. • The line might be due to interstitial defects, or the 73Ge dopant.
Some Properties of 107Cd and 107Ag • Cd is isoelectronic to Zn. • Ag introduces deep acceptor levels in group II-VI semiconductors such as CdTe and ZnTe. • 107Cd is neutron poor, decays via electron capture: • 107Cd has half-life of 6.5 hours, with a decay energy of 1.42 MeV. • Concentrations of the dopants are given by:
107Cd Doped ZnO • No lines with a systematic decay, which could be attributed to 107Cd. • TES(I4) line at 3.330 eV remains constant, used to normalize all peaks. • DA line at 3.340 eV grows exponentially. • Exponential fit of the Normalized intensity of this line gives a half-life of 5.3 hours with 19% uncertainty.
ZnO Nanorods Sample A (grown with 20 Ǻ Au catalyst). Sample B (grown with 52 Ǻ Au catalyst). • PL of sample B red shifted from that of sample A, indicating quantum confinement. • Higher Au catalyst concentration increases nanorod radius. Grabowska et al., Dublin City University.
Green band of ZnO Nanorods Sample C. Aligned Nanorods grown with conditions similar to A. • Green band intensity increases as nanorod radius decreases. Higher vacancy density in thinner nanorods. • Intensity decreases for sample C. Alignment reduces the percentage of vacancies.
Summary • A 3.363 eV line is identified as Ga-related and a 3.326 eV line is attributed to Ge or interstitial defects. • As a potential discovery of a shallow acceptor, the half-life of a 3.340 eV line indicates that it might be Ag-related. • An increase in Au catalyst concentration during growth increases the ZnO nanorod size. • An increase green band intensity as radius decreases indicates higher vacancy densities in thinner nanorods. • Nanorod aligment reduces the percentage of vacancies present.