Download
1 / 8
90 likes | 246 Vues
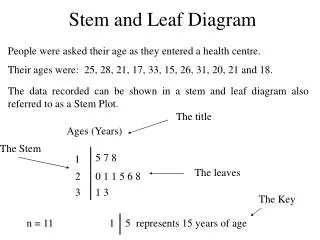
Stem and Leaf Displays. Are devices used to organize and group data without losing the data. The actual data forms the display. Making Stem and Leaf Displays. Divide the digits of each data into two parts. The leftmost part is called the stem while the rightmost part is called the leaf.

E N D
Stem and Leaf Displays • Are devices used to organize and group data without losing the data. The actual data forms the display.
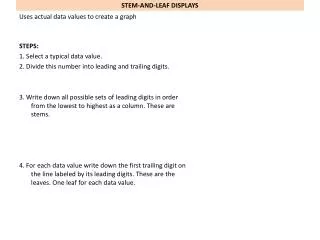
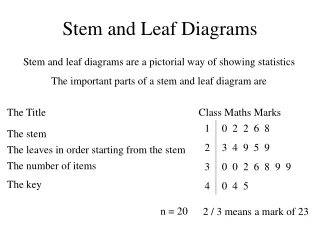
Making Stem and Leaf Displays • Divide the digits of each data into two parts. The leftmost part is called the stem while the rightmost part is called the leaf. • Align all the stems in a vertical column from smallest to largest. Draw a vertical line to the right of all stems. • Place all the leaves with the same stem on the same row as the stem, and arrange the leaves in increasing order. • Use a label to indicate the magnitude of the numbers in the display. (Do not put decimals in the stems or leaves).
2.3 Problem #1 • Make stem and leaf display for ages of cowboys. • 52 68 86 72 66 97 89 84 91 91 • 66 68 87 86 73 61 70 75 72 73 • 85 84 90 57 77 76 84 93 58 47
Stem and Leaf Display for 2.3#1 4|7 = 47 years
When a stem has many leaves it is useful to split stem • into two lines or more. For two lines, place leaves 0 to 4 • on first line and leaves 5 to 9 on next line. • Section 3.2 # 5(a). Make stem and leaf display with two • lines per leaf for the following data which represents • minutes over 2 hours for winning times in Boston Marathon • from 1961 to 1980. • 23 18 19 16 17 15 22 13 10 • 18 15 16 13 9 20 14 10 9 12
Launch Temperatures Make a back-to-back stem and leaf display for launch temperatures of 23 space shuttle missions prior to the Challenger disaster. Flights with O-ring damage (temp oF) : 53 57 58 63 70 70 75 Flights with no O-ring damage (temp oF): 66 67 67 67 68 69 70 70 72 73 75 76 76 78 79 81