Download
1 / 8
170 likes | 937 Vues
Quantitative and qualitative. Quantitative data – expressed as numbers Qualitative data – difficult to measure sensibly as numbers, e.g. count number of words to measure dissatisfaction Quantitative analysis – numerical methods to ascertain size, magnitude, amount

E N D
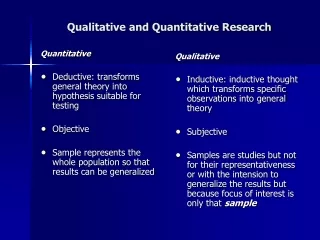
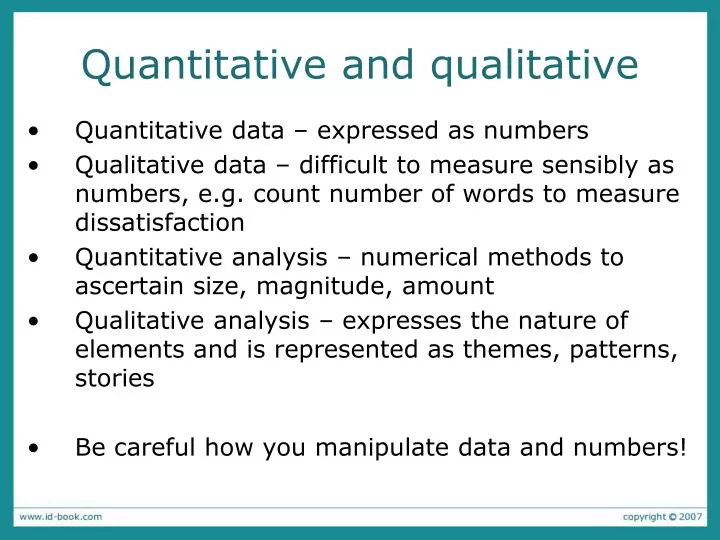
Quantitative and qualitative • Quantitative data – expressed as numbers • Qualitative data – difficult to measure sensibly as numbers, e.g. count number of words to measure dissatisfaction • Quantitative analysis – numerical methods to ascertain size, magnitude, amount • Qualitative analysis – expresses the nature of elements and is represented as themes, patterns, stories • Be careful how you manipulate data and numbers!
Simple quantitative analysis • Averages • Mean: add up values and divide by number of data points • Median: middle value of data when ranked • Mode: figure that appears most often in the data • Percentages • Graphical representations give overview of data
Simple qualitative analysis • Unstructured - are not directed by a script. Rich but not replicable. • Structured - are tightly scripted, often like a questionnaire. Replicable but may lack richness. • Semi-structured - guided by a script but interesting issues can be explored in more depth. Can provide a good balance between richness and replicability.
Visualizing log data Interaction profiles of players in online game Log of web page activity
Simple qualitative analysis • Recurring patterns or themes • Emergent from data, dependent on observation framework if used • Categorizingdata • Categorization scheme may be emergent or pre-specified • Looking for critical incidents • Helps to focus in on key events
Try it out • Preece etal (2007, 2nd edn) p. 380/382 give you a short text that you could use for practising some coding according to prescribed categories • Have a go at Activity 8.2 (p. 381) • How did you go ? • Would this be appropriate for your data?
Tools to support data analysis • Spreadsheet – simple to use, basic graphs • Statistical packages, e.g. SPSS • Qualitative data analysis tools • Categorization and theme-based analysis, e.g. N6 • Quantitative analysis of text-based data • CAQDAS Networking Project, based at the University of Surrey (http://caqdas.soc.surrey.ac.uk/)
Summary • The data analysis that can be done depends on the data gathering that was done • Qualitative and quantitative data may be gathered from any of the three main data gathering approaches • Percentages and averages are commonly used in Interaction Design • Mean, median and mode are different kinds of ‘average’ and can have very different answers for the same set of data