Download
1 / 14
160 likes | 529 Vues
Section 2.6 Graphs of Functions. Finding function values graphically Finding Domain and Range graphically Graphs of non-linear functions Translations of graphs Reflections of graphs. Finding Function Values from a Graph. Find f(-3) Find the x value that causes f(x) = -2.

E N D
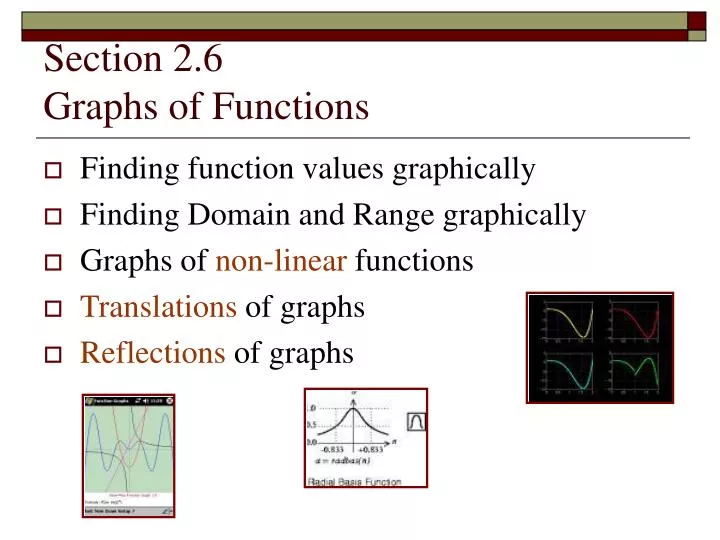
Section 2.6Graphs of Functions • Finding function values graphically • Finding Domain and Range graphically • Graphs of non-linear functions • Translations of graphs • Reflections of graphs
Finding Function Values from a Graph • Find f(-3) • Find the x value that causes f(x) = -2
Finding Domain & Range from a Graph • Usually, the domain & range of a straight line is the whole set of real numbers
Graphing Nonlinear Functions - We need to calculate and plot more points • The squaring function • What is the Domain and the Range of this function? • A Parabola is formed when one variable is squared
Nonlinear Functions The cubing function What is the domainand range of the cubing function?
Nonlinear Functions • The absolute value function • What is the domainand range of the absolute value function?
Vertical Translations of Graphs • If f(x) = x2 what is f(x) + 3 and f(x) – 4 • Graph the equations: • f(x) = x2 • f(x) = x2 + 3 • f(x) = x2 – 4 • What do you notice?
Vertical Translations If ƒ is a function and k is a positive number, then • The graph of y = ƒ(x) + kis identical to the graph of y =ƒ(x) except that it is translatedkunits upward. • The graph of y = ƒ(x) - kis identical to the graph of y = ƒ(x) except that it is translatedkunits downward. • Another example:
Horizontal Translations of Graphs • If f(x) = x2 what is f(x+2) and f(x–3) • Graph the equations: • f(x) = x2 • f(x) = (x+2)2 • f(x) = (x–3)2 • What do you notice?
Horizontal Translations – a little tricky If ƒ is a function and h is a positive number, • Then the graph of y = ƒ(x -h) is identical to the graph of y = ƒ(x) except that it is translated hunits to the right. • The graph of y = ƒ(x +h) is identical to the graph of y = ƒ(x) except that it is translated hunits to the left. • Another example:
x-Axis Reflections • The graph of y= -ƒ(x) is the graph of y =ƒ(x) reflected about the x-axis.
In Class Examples • For each function,1. What is the basic function and its shape?2. How will it be translated or reflected?
Test 1 (Chapters 1 & 2) • Test 1 (1.1-2.6) will be a week from today at 3:05 sharp • Homeworks 3.1 & 3.2 are due at start of class • Section 3.3 and part of 3.4 will be covered after the test • The test will be 1.5 hours long, Over at 4:35, lecture at 4:45 • All chapter tests are closed book, no graphing calculators, no phone calculators, no class notes • All tests count toward your grade • If you are absent on test day, you must take the test in the Math Lab HM220 before the start of our next class. • Most test questions will closely resemble material practiced on written and online homework • You must show all work for a solution to receive full credit for a question. Some questions are not eligible for partial credit. • Scratch paper is attached to the test. Turn it in with the test.
What Next? • Present Section 3.1Solving Systems of Equations by Graphing • Reminder: Test 1 is a week from today,