Download
1 / 10
140 likes | 620 Vues
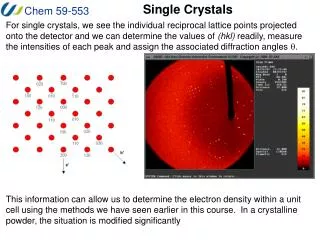
Single Crystals. For single crystals, we see the individual reciprocal lattice points projected onto the detector and we can determine the values of (hkl) readily, measure the intensities of each peak and assign the associated diffraction angles q .

E N D
Single Crystals For single crystals, we see the individual reciprocal lattice points projected onto the detector and we can determine the values of (hkl) readily, measure the intensities of each peak and assign the associated diffraction angles q. This information can allow us to determine the electron density within a unit cell using the methods we have seen earlier in this course. In a crystalline powder, the situation is modified significantly
Powder XRD If a powder is composed of numerous crystallites that are randomly oriented (“all” possible orientations are present), the reciprocal lattice points for each of the crystallites combine to form spheres of reflection. Since these spheres will always intersect the Ewald sphere, at the detector, we observe these as circles and we can only measure the diffraction angle q of the rings.
Powder XRD We lose a considerable amount of information because the 3D (hkl) data for each of the single crystal reflections is effectively reduced to 1D (q) data in the powder XRD spectrum. Furthermore, the overlap of peaks (because of necessary or accidentally similar d-spacings) makes the interpretation of the intensity data more complicated. In a modern XRD experiment, the diffraction patterns shown on the right are integrated to provide plots of the type shown on the left. Although much of the information that we would prefer to have for structure solution is “gone”, XRD can provide much information and, in some cases, structure solution is possible.
Powder XRD Despite the apparent limitations, XRD is very useful for the identification of compounds for which structural data has already been obtained. For example, applications in WinGX (LAZY Pulverix), the ICSD, Mercury, Diamond and PowderCell will calculate the XRD pattern for any known structures. Below is the calculated powder XRD pattern for the [nBu4N][MeB(C6F5)3] structure we examined in the refinement part of the course. This assigned XRD pattern was calculated using PowderCell, which is a particularly useful program for any of you who wish to use our powder diffractometer. The program is also useful because it can be used to examine and predict how a diffraction pattern is altered when unit cell parameters or fractional coordinates are changed (such modifications can occur when the temperature of an experiment is changed).
Powder XRD The predicted spectra for the real structure (left) and a model in which one nBu group has been rotated by 90º (shown in yellow). The differences in intensities illustrates the phase problem.
Powder XRD Since the XRD pattern of known structures can be calculated, XRD may be used to confirm or deny the presence of a particular compound (or phase of a compound) when large single crystals are not available. Thus powder XRD can be used to assess the purity of samples and it can be used to determine the relative proportions of known phases in powders that are mixtures of two phases. For crystals with highly symmetric space groups (such as cubic), it is usually easy to assign the Miller indices to the individual peaks using a rearranged form of the Bragg equation: sin2qhkl = (l2/4a2)(h2 + k2 + l2) Using such an approach, the type of lattice can be identified, the value of a can be determined and sometimes the structure can be deduced. Similar equations can be derived for the other crystal systems, however the assignment of peaks becomes significantly more difficult as the number of variables increases.
Powder XRD In situations where the symmetry is still relatively high (such as the tetragonal system shown below) it is sometimes possible to use powder XRD data to solve the crystal structure. The approach that is most commonly used for such structure solution is the Rietveld method. We have a site license for DASH (from the CCDC) which we can use for such solution and refinement. In the Rietveld method, an approximate structure model is modified (as I demonstrated with the nBu group) to fit the calculated intensities to the observed intensities, as shown in the picture on the right. An example of structures solved in this manner is depicted below.
Powder XRD Other information is available from the shapes of the peaks observed in powder XRD experiments. In particular, the size of very small (nanoscale) crystallites can be estimated. For a typical crystal of the size we use for single-crystal diffraction experiments (and even for microscopic-sized crystallites), there are an essentially infinite number of lattice points and planes. It is because of this infinite number of planes that Bragg’s law holds – for an incident X-ray beam with q’ slightly different than the Bragg angle, a reflection off of one plane close to the surface of the crystal will be cancelled exactly by the reflection off of a plane deep within the crystal. In a very small crystallite in the nanometer range, there are not enough planes to cause perfect cancellation for the diffracted X-rays close to the Bragg angle. Because of this, the q range for each peak increases so the peaks will be broadened. One can thus use the peak broadening to estimate the size of the crystallites.
Powder XRD The most simple relationship used to estimate particle size is the Scherrer formula: Dv = Kl/(b cos q) where: Dv is the “volume weighted” crystallite size = ¾ d (crystallite diameter) K is the somewhat arbitrary “Scherrer constant” (around 0.9 to 1.0) l is the wavelength of the X-rays q is the Bragg angle for the peak at 2q b is the “integral breadth” of the peak at 2q Note that b = (p/2) FWHM (full width at half maximum) for a Gaussian shaped peak. More complicated peak-shape analyses can be used for more accurate estimates that take broadening caused by the instrument and strain in the sample into account. The size estimates obtained in this manner are complementary to those obtained by high-resolution TEM, STM etc.
Conclusion I hope that you have gained a deeper understanding of and a better appreciation for some applications of X-ray diffraction to the study of Chemistry. In contrast to many of the other topics in Chemistry, there are a huge number of websites and books that you can consult if you have any further questions about aspects of X-ray diffraction. Furthermore, I am always willing to try to help you with any problems you have with X-ray crystallography.