Download
1 / 24
240 likes | 505 Vues
Warmup. Please complete a scatterplot for the data. You will be using this graph repeatedly today so use a full page and make it a good one. Warmup Check. Experimental Design. Independent, Dependent, and Controlled Variables Accuracy, Precision, Standard Deviation Correlation

E N D
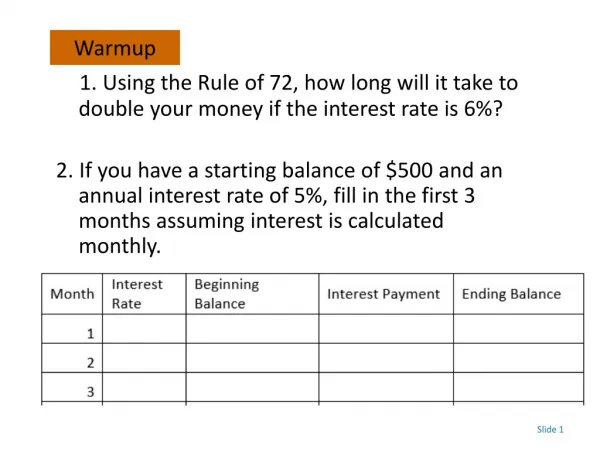
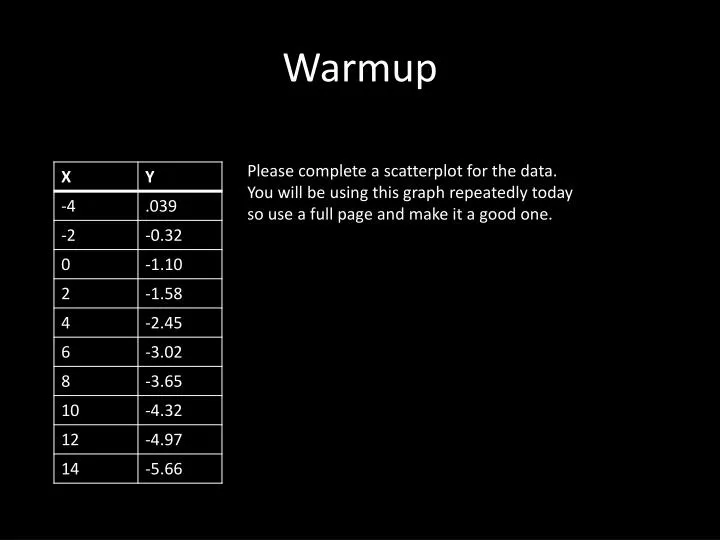
Warmup Please complete a scatterplot for the data. You will be using this graph repeatedly today so use a full page and make it a good one.
Experimental Design • Independent, Dependent, and Controlled Variables • Accuracy, Precision, Standard Deviation • Correlation • Placebos, Trials, Control Groups, Baselines, Reversals • September 9 2011, Western Sierra
Scientific Method Review Independent variable – the cause – we change it around ex: How much we make the spider move. Dependent variable – the effect – we measure what happens ex: The percent chance my cat will eat it. Controlled variables – everything else stays the same. ex: Object size, object appearance, object smell, time of day hungriness of cat, room lighting, how long the cat sees it.
Guided Practice Is Grandma’s advice of adding bran and prune juice to your diet really beneficial to your stomach? Independent Variable (IV): Dependent Variable (DV): Controlled Variables (CV’s): 2) If a baby shows surprise and delight when playing peekaboo, then it cannot yet remember that objects exist unless it can see them. IV: DV: CV’s: 3) How many times do I need to see a vocabulary word and its definition, in order to memorize it with 99% accuracy? IV: DV: CV’s:
Do people who watch too much tv really have mushy brains?Identify the dependent variable. • age of subject • TV amount • mushiness of brains • commercial break frequency • zombie appetite • none of the above
How many mealworms does it take to make Zuldjian stink up the room a day later?Identify the Independent Variable. • Mealworms • Heat • Time delay • Stink • All of the above • None of the above
A person asks, “Are all brands of potato chips equally greasy?” What is the independent variable? • Grease • Number of chips • Testing method • Potato chip brand • Flavor • None of the above
A person predicts, “If I don’t eat breakfast, then I’ll be grouchy later.”What is a controlled variable? • Breakfast or not • Mood later • Events during the day • Exercise • Both 3 and 4 • None of the above
If you eat more chocolate, then you will get more acne. • IV: Acne DV: Chocolate CV: Age, Gender • IV: Age, Chocolate DV: Gender CV: Acne • IV: Chocolate DV: Acne CV: Age, Gender • IV: Hormones DV: Teens CV: ProActiv Cream • IV: Oils DV: Acne CV: Age, Gender, Treatment, Facewashing, Sun exposure • None of the above
Accuracy, Precision, and Std. Dev. Accuracy is getting close to the ‘right’ answer. Precision is happening with consistency, i.e. you get the same result when you repeat the experiment. Standard Deviation is the most common statistical method used for the precision concept.
Accuracy, Precision, and Std. Dev. Step 2 Step 3 Find the mean of the data. Subtract the mean from each data point. Square the difference. Find the average of the squares. Take the square root of the average. Step 1 Step 4 Step 5
What could you say about the accuracy and precision of the following data, where the accepted value is 4.3:(6.0, 6.1, 5.9, 5.8, 6.2) • Precision: ±.2 Accuracy: ±3 Standard Dev: ±.32 • Precision: ±.2 Accuracy: ±1.7 Standard Dev: ±.16 • Precision: ±.5 Accuracy: ±2 Standard Dev: ±.32 • Precision: ±.2 Accuracy: ±1.7 Standard Dev: ±.20 • None of the above
What could you say about the accuracy and precision of the following data, where the accepted value is 9.0:(9.8, 8.1, 9.1, 8.7, 9.3) • Precision: ±.2 Accuracy: ±0 StDev: ±.90 • Precision: ±.9 Accuracy: ±1 StDev: ±.50 • Precision: ±.9 Accuracy: ±0 StDev: ±.64 • Precision: ±0 Accuracy: ±.9 StDev:±.64 • None of the above
Correlation Definition 1 Positive Correlation- when two things tend to happen together. Negative Correlation – when one thing happens more, the other thing happens less. No Correlation – two events seem unrelated. Definition 2 You were able to show a relationship but not prove cause-and-effect. You did not use enough controlled variables in your experiment. Example: The more books you own as a child, the smarter you end up. Problem: Are the books making you smart? (cause = books) Are parents who care about reading making you smart? (cause = parents) Are good schools in wealthy neighborhoods where parents can afford books making you smart? (cause = location\wealth) Is a chemical in the ink evaporating near your crib and making you smart? (cause = ink fumes)
Individual Practice (Application level) Sort these events into the categories ‘correlated’ and ‘cause and effect’ based on whether or not you think there’s a clear unambiguous cause and effect, or if they merely happened one after the other. Hammer hits nail, nail goes into wall Scary movie plays, baby cries It rains, people open umbrellas Building falls over, earthquake happens Correlated Cause and Effect
Multiple Trials Multiple Trials – Repeating each part of the experiment, and averaging the results, in order to check your precision and increase your overall accuracy. Hypothesis – If runners wear better shoes, then they go faster. Multiple Trials - Three track stars run with each shoe four times. Average results. Why - In case one athlete has a bad day, it doesn’t ruin the experiment’s data. More trials improves accuracy.
Baselines Baseline – when you take lots of measurements before you make the first change to your independent variable. “How does doing situps raise your heart rate , compared to watching tv?” Is the data below useful in answering the question? How would you fix the data?
Baselines Which of the following experiments need a baseline measurement before applying the independent variable? Which fertilizer helps plants grow the most? Will a new medicine helps people’s moods? Do angry barbarians pillage a village faster than regular ones?
Control Groups, Placebo Read the paragraph describing some research, and write down the hypothesis, independent variable, dependent variable, and controlled variables. Also discuss why it might be important to provide a fake pill called a placebo, and why it is important to include a group which took no pills at all. A drug company hired a group of 500 people who suffer from migraines and 100 people who do not. Both groups were asked to rate their daily headache’s severity on a scale of 0 to 3, with 0 being no headache at all, for a period of 3 months. They then randomly assigned 100 people to take a low dose of the drug, 100 people to take a medium dose of the drug, 100 people to take a high dose of the drug, 100 people to take a fake pill which looks just like a real one but has only sugar in it, and 100 people to take no pill at all. After initial results came in, the enrollees were asked to continue rating headaches on the same scale for an additional 3 months.
Control Group, Placebo Control Group 1) Runs concurrently (at the same time) as the other groups and trials. 2) Is an instance where the independent variable has not been applied, i.e. no fertilizer, run barefoot, no water, etc. Placebo 1) Is a special control group which gets faked out. 2) Compensates for psychological effects.
Reversals Reversals – Midway through the experiment, you go back to baseline. A = baseline B = experiment w/ independent variable applied ABAB reversal helps prove cause and effect if it’s normal during the first baseline, changes during the first B-phase, then reverts to baseline, then changes again during B-phase. Example: An allergy medicine company measures people’s allergies for a year. Then it gives them a drug for a year, and they mostly seem to get better. If they stop the experiment, they’ll never know if something like a forest fire killed the trees making pollen, or some other factor caused the change. But if they then take away the medicine and the symptoms come back, and then repeat the experiment and the symptoms go away again then they can be pretty sure the medicine causes the cure.
Compare and Contrast, Olympic Style! Placebo Control Group Reversals Baseline Trials
Review Please review with your neighbor the meaning of the following vocabulary or concepts: Hypothesis Independent Variable Dependent Variable Controlled Variable Accuracy Precision Standard Deviation Correlation Multiple Trials Baseline Control Group Placebo Reversals