Download
1 / 21
210 likes | 356 Vues
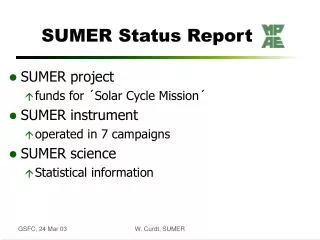
Sunspot Studies in Oslo with CDS,SUMER,MDI and TRACE A final report (maybe). Olav Kjeldseth-Moe, Per Maltby , Terje Fredvik and Nils Brynildsen Institute of Theoretical Astrophysics University of Oslo. Program History. Sunspot studies with SOHO instruments from 06/1996.

E N D
Sunspot Studies in Oslowith CDS,SUMER,MDI and TRACEA final report (maybe). Olav Kjeldseth-Moe, Per Maltby, Terje Fredvik and NilsBrynildsen Institute of Theoretical Astrophysics University of Oslo
Program History • Sunspot studies with SOHO instruments from 06/1996. • Study the transition region and corona above spots, particularly the fast down flows into sunspot umbrae observed with HRTS. • Redshifts in the transition region in general. • Sunspot plumes and 3 min oscillations in the sunspot umbrae chromosphere and transition region. • O_SPOT – studies run between 26 June 1996 and 22 February 2005. • A total of 133 sunspots observed on 209 days. • All O_SPOT data are processed into intensity and velocity maps.
Topics for investigations. • Rediscovery of sunspot plumes: • Definition and characteristic properties. • Downflows in plumes • Upflows? • 3 min oscillations in the sunspot transition region umbra: • Oscillation studies of sunspots with NIS and GIS for proper temperature mapping in the TR. • Nature of the oscillations. • Extension of oscillations into the corona. • Rapid time variability of sunspot emission. • Multiple line profiles and dual flows in sunspots. • Relations between intensities, flows and magnetic fields inside active areas.
- A 50 arc sec overlapping area, with ~30 s and ~2 min cadence - Easy to distinguish changes over 5 min time periods. - Perceptible changes over time spans of ~2 min.
Intensity and flows in plumes • Concentrations of EUV line emission in bright "plumes" over sunspot umbrae. • Strong emission and high red-shifts, i.e. down flows, in plumes. • Downflow velocity increase with temperature to a max at log T ~ 5.5. • Flow field in the low corona differ markedly from that in the transition region. • Upflows missing in the 120” x 120” FOV. • Upflows somwhere in an extended region? - to be checked.
Mapping of • plumes • - Located above the • white light spot • - I > 5 x <I> i.e. • yellow contour • - Max visibility at • 0.25 MK – do not • occur in corona, • i.e. cool • - Down flows into • the spots in TR • - No corresponding • up-flows • - No systematic • flows in corona • Up-flows in • extended area? • (large raster)
Mapping of • plumes • - Located above the • white light spot • - I > 5 x <I> i.e. • yellow contour • - Max visibility at • 0.25 MK – do not • occur in corona, • i.e. cool • - Down flows into • the spots in TR • - No corresponding • up-flows • - No systematic • flows in corona • Up-flows in • extended area? • (large raster)
Supersonic dual flows - topic 4 Left (top): Gaussian line profiles and zero shift. Left (bottom): Dual flow line profiles, v ~100 km s-1. Right: Line of sight velocities for dual NV and OV lines. Sound speeds plotted in
Regions with dual flows Sunspots with dual flows in OV and NV in 4 active regions. Area fractions with supersonic dual flow components range from ~1% to 38% for OV in the umbra of AR8998.
Intensities, line shifts and magnetic fields - topic 5 • Line profiles with large intensities and red shifts above the average constitute an increasing fraction of the profiles as the relative wavelength shift increases • Line profiles with large intensities and blue shifts compared to the average, on the other hand, constitute a decreasing fraction of the profiles as the relative wavelength shift increases • Results have been obtained by conditional probability analysis
Conditional probabilities for redshifted (blueshifted) with larger than average intensity as a function of the velocity. Left: Sumer results for 6 different lines. Above: Comparison of SUMER and CDS data. Full line: redshifts; dotted line: blueshifts.
Oscillations and GIS studies- topic 2 • OSPOT_11 and OSPOT_10 for studies of oscilliation with NIS and GIS, respectively. • SUMER studies of oscillations • Confirm presence of 3 min oscillations in sunspot umbrae found at 100,000 K (CIV 155 nm lines) by Joe Gurman. • Are sunspot oscillations sound waves? • Temperature mapping of oscillations. • Do they extend to the corona??
Amplitudes, their temperature dependence and frequencies • Distribution of intensity amplitude values. • Intensity amplitudes in the range 0.05-0.15. • Amplitudes as a function of temperature. • Maximum amplitudes at ≈100,000 K • Frequency of oscillations - distribution. • Frequencies 5.5 - 6.5 mHz -- 3 min - 2.5 min periods
Cont.: Observed and Calculated velocity • Sound wave equation for a polytropic gas = f(v). • I = constant x --> c I1/2. A perfect fit if we allow for the helio- centric position of the sunspot!
Blue wing - red wing variations. • Oscillation amplitudes larger in the blue line wing than in the red wing. • Compression is larget when the gas is moving in the direction that the wave propagates, i.e. towards us for an upward running wave. • Max power at the same period in both wings.
Oscillations summary so far • Oscillations with periods ~ 3 min are seen both in intensity and in line-of-sight velocity above sunspot umbrae • Maximum intensity is nearly in phase with maximum velocity directed towards the observer. • Oscillation amplitude above the umbra increases with increasing temperature to a maximum for lines formed ~ 2 x 10⁵ K, and decreases for higher temperatures. • Oscillations are more pronounced in the blue than in the red wing of the lines • Supports running progressive waves