Download
1 / 55
550 likes | 779 Vues
Grids and the School of Informatics at Indiana University. Sun Yat-sen University Guangzhou China November 4 2006 Geoffrey Fox Computer Science, Informatics, Physics Pervasive Technology Laboratories Indiana University Bloomington IN 47401 gcf@indiana.edu http://www.infomall.org.

E N D
Grids and theSchool of Informatics at Indiana University Sun Yat-sen University Guangzhou China November 4 2006 Geoffrey Fox Computer Science, Informatics, Physics Pervasive Technology Laboratories Indiana University Bloomington IN 47401 gcf@indiana.edu http://www.infomall.org
The Central Goalof Informatics data information knowledge
What is Informatics? • Informatics is the integration of the art, science, and the human dimensions of information technology to provide solutions to discipline-specific problems • Informatics is a response to the data/information/knowledge gaps (data deluge) caused by “billions and billions of bits” • Grids are technology supporting this in distributed research
Bioinformatics Data DelugeChallenge and Opportunity 2000 1985 1 experiment 1 experiment 1 gene 10,000 genes OPPORTUNITY 10 data 10,000,000 data CHALLENGE
Tech Centered Informatics Domain Centered Informatics Computer & Information Science including Web, Text, Data Mining Bio-, Health-, Chemical-, Music-, etc. Informatics, e-Science, Complex systems, Modeling, Simulation Human Centered Informatics Human Computer Interaction, New Media,Social/Organizational Informatics, Security
B.S. Computer Science (IUB) Informatics (IUB/IUPUI/IUSB) New Media: Media Arts and Science (IUPUI) Health Information Administration (IUPUI) M.S. Computer Science (IUIB) New Media: Media Arts and Science (IUPUI) Human Computer Interaction (IUB/IUPUI) Bioinformatics (IUB/IUPUI) Chemical Informatics (IUB/IUPUI) Music Informatics (IUB) Laboratory Informatics (IUPUI) Health Informatics (IUPUI) Cybersecurity (IUB) Ph.D. Computer Science (IUB) Informatics (IUB/IUPUI) School of Informatics Programs • Indiana University has 8 separate campuses • School currently at 3 of 8 campuses • Largest Campuses: • IUB Bloomington • IUPUI Indianapolis
IUB Faculty with One or More of Degrees Listed -- undergrad or grad -- of 65 total faculty CS 40 Journalism 1 Math 7 Library/Info Science 2 Chemistry 4 Linguistics 1 Hist.of Sci./Tech. 3 Physics 5 Philosophy 2 Psychology 2 EE 3 Mathematics 5 Biology 2 Design 1 Comp. Lit. 1 Cog. Sci. 2 Anthropology 1 Aero. Engineering 1 Music 2 Public Policy 1
Undergraduate Profile– Bloomington • Informatics Majors (BS):............................. 382 students • Computer Science (BS and BA): .................. 135 students • Women: ...................................................... 13% • International Students: .............................. 8% • Number of Undergraduates Statewide: ....... 1,250 • Average Starting Salary : ............................ $42,000 • Placement rate …………………………………….. 90% • Note BA in Computer Science administered by the College of Arts and Sciences
e-moreorlessanything and the Grid • ‘e-Science is about global collaboration in key areas of science, and the next generation of infrastructure that will enable it.’ from its inventor John Taylor Director General of Research Councils UK, Office of Science and Technology • e-Science is about developing tools and technologies that allow scientists to do ‘faster, better or different’ research • Similarly e-Business captures an emerging view of corporations as dynamic virtual organizations linking employees, customers and stakeholders across the world. • The growing use of outsourcing is one example • The Grid provides the information technology e-infrastructure for e-moreorlessanything. • A deluge of data of unprecedented and inevitable size must be managed and understood. • People, computers, data and instruments must be linked. • On demand assignment of experts, computers, networks and storage resources must be supported
Why Grids/ Cyberinfrastructure Useful • Supports distributed science – data, people, computers • Exploits Internet technology (Web2.0) adding management, security, supercomputers etc. • It has two aspects: parallel – low latency (microseconds) between nodes and distributed – highish latency (microseconds) between nodes • Parallel needed to get high performance on individual 3D simulations, data analysis etc.; must decompose problem • Distributed aspect integrates already distinct components • Cyberinfrastructure is in general a distributed collection of parallel systems • Grids are made of services that are “just” programs or data sources packaged for distributed access
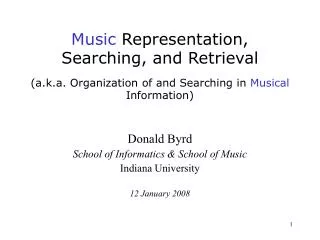
TeraGrid: Integrating NSF Cyberinfrastructure Buffalo Wisc UC/ANL Cornell Utah Iowa PU NCAR PSC IU NCSA Caltech ORNL USC-ISI UNC-RENCI SDSC TACC TeraGrid is a facility that integrates computational, information, and analysis resources at the San Diego Supercomputer Center, the Texas Advanced Computing Center, the University of Chicago / Argonne National Laboratory, the National Center for Supercomputing Applications, Purdue University, Indiana University, Oak Ridge National Laboratory, the Pittsburgh Supercomputing Center, and the National Center for Atmospheric Research. Today 100 Teraflop; tomorrow a petaflop; Indiana 20 teraflop today.
Virtual Observatory Astronomy GridIntegrate Experiments Radio Far-Infrared Visible Dust Map Visible + X-ray Galaxy Density Map
Grid Capabilities for Science • Open technologies for any large scale distributed system that is adopted by industry, many sciences and many countries (including UK, EU, USA, Asia) • Security, Reliability, Management and state standards • Service and messaging specifications • User interfaces via portals and portlets virtualizing to desktops, email, PDA’s etc. • ~20 TeraGrid Science Gateways (their name for portals) • OGCE Portal technology effort led by Indiana • Uniform approach to access distributed (super)computers supporting single (large) jobs and spawning lots of related jobs • Data and meta-data architecture supporting real-time and archives as well as federation • Links to Semantic web and annotation • Grid (Web service) workflow with standards and several successful instantiations (such as Taverna and MyLead) • Many grids including Bioinformatics Chemistry and Earth Science • http://www.nsf.gov/od/oci/ci-v7.pdf
APEC Cooperation for Earthquake Simulation • ACES is a seven year-long collaboration among scientists interested in earthquake and tsunami predication • iSERVO is Infrastructure to supportwork of ACES • SERVOGrid is (completed) US Grid that is a prototype of iSERVO • http://www.quakes.uq.edu.au/ACES/ • Chartered under APEC – the Asia Pacific Economic Cooperation of 21 economies
Field Trip Data Database ? GISGrid Discovery Services RepositoriesFederated Databases Streaming Data Sensors Database Sensor Grid Database Grid Research Education SERVOGrid Compute Grid Customization Services From Researchto Education Data FilterServices ResearchSimulations Analysis and VisualizationPortal EducationGrid Computer Farm Grid of Grids: Research Grid and Education Grid
SERVOGrid and Cyberinfrastructure • Grids are the technology based on Web services that implement Cyberinfrastructure i.e. support eScience or science as a team sport • Internet scale managed services that link computers data repositories sensors instruments and people • There is a portal and services in SERVOGrid for • Applications such as GeoFEST, RDAHMM, Pattern Informatics, Virtual California (VC), Simplex, mesh generating programs ….. • Job management and monitoring web services for running the above codes. • File management web services for moving files between various machines. • Geographical Information System services • Quaketables earthquake specific database • Sensors as well as databases • Context (dynamic metadata) and UDDI system long term metadata services • Services support streaming real-time data
a Site-specific Irregular Scalar Measurements a Constellations for Plate Boundary-Scale Vector Measurements Ice Sheets a Volcanoes PBO Greenland Long Valley, CA Topography 1 km Stress Change Northridge, CA Earthquakes Hector Mine, CA
Some Grid Concepts I • Services are “just” (distributed) programs sending and receiving messages with well defined syntax • Interfaces (input-output) must be open; innards can be open source (allowing you to modify) or proprietary • Services can be any language from Fortran, Shell scripts, C, C#, C++, Java, Python, Perl – your choice!! • Web Services supported by all vendors (IBM, Microsoft …) • Service overhead will be just a few milliseconds (more now) which is < typical network transit time • Any program that is distributed can be a Web service • Any program taking execution time ≥ 20ms can be an efficient Web service
Web services • Web Services build loosely-coupled, distributed applications, (wrapping existing codes and databases) based on the SOA (service oriented architecture) principles. • Web Services interact by exchanging messages in SOAPformat • The contracts for the message exchanges that implement those interactions are described via WSDL interfaces.
PortalService Security Catalog A typical Web Service • In principle, services can be in any language (Fortran .. Java .. Perl .. Python) and the interfaces can be method calls, Java RMI Messages, CGI Web invocations, totally compiled away (inlining) • The simplest implementations involve XML messages (SOAP) and programs written in net friendly languages like Java and Python PaymentCredit Card Web Services WSDL interfaces Warehouse Shipping control WSDL interfaces Web Services
Some Grid Concepts II • Systems are built from contributions from many different groups – you do not need one “vendor” for all components as Web services allow interoperability between components • One reason DoD likes Grids (called Net-Centric computing) • Grids are distributed in services and data allowing anybody to store their data and to produce “their” view • Some think that University Library of future will curate/store data of their faculty • “2 level programming model”: Classic programming of services and services are composed using workflow consistent with industry standards (BPEL) • Grid of Grids: (System of Systems) Realistically Grid-like systems will be built using multiple technologies and “standards” –integrate separate Grids for Sensors, GIS, Visualization, computing etc. with OGSA (Open Grid Service Architecture from OGF) system Grid (Security, registry) into a single Grid • Existing codes UNCHANGED; wrap as a service with metadata
LEAD Gateway Portal NSF Large ITR and Teragrid Gateway - Adaptive Response to Mesoscale weather events - Supports Data exploration,Grid Workflow
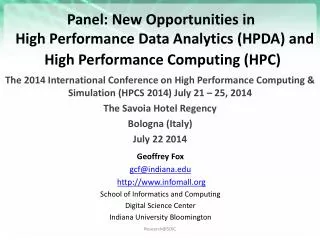
6 ≤ M 5 ≤ M ≤ 6 Background: Earthquake Forecast – Published Feb 19, 2002, in PNAS. ( JB Rundle et al., PNAS, v99, Supl 1, 2514-2521, Feb 19, 2002; KF Tiampo et al., Europhys. Lett., 60, 481-487, 2002; JB Rundle et al.,Rev. Geophys. Space Phys., 41(4), DOI 10.1029/2003RG000135 ,2003. http://quakesim.jpl.nasa.gov) Color Scale Decision Threshold D.T. => “false alarms” vs. “failures to predict” Eighteen significant earthquakes (M > 4.9; blue circles) have occurred in Central or Southern California. Margin of error of the anomalies is +/- 11 km; Data from S. CA. and N. CA catalogs: After the work was completed 1. Big Bear I, M = 5.1, Feb 10, 2001 2. Coso, M = 5.1, July 17, 2001 After the paper was in press ( September 1, 2001 ) 3. Anza I, M = 5.1, Oct 31, 2001 After the paper was published ( February 19, 2002 ) 4. Baja, M = 5.7, Feb 22, 2002 5. Gilroy, M=4.9 - 5.1, May 13, 2002 6. Big Bear II, M=5.4, Feb 22, 2003 7. San Simeon, M = 6.5, Dec 22, 2003 8. San Clemente Island, M = 5.2, June 15, 2004 9. Bodie I, M=5.5, Sept. 18, 2004 10. Bodie II, M=5.4, Sept. 18, 2004 11. Parkfield I, M = 6.0, Sept. 28, 2004 12. Parkfield II, M = 5.2, Sept. 29, 2004 13. Arvin, M = 5.0, Sept. 29, 2004 14. Parkfield III, M = 5.0, Sept. 30, 2004 15. Wheeler Ridge, M = 5.2, April 16, 2005 16. Anza II, M = 5.2, June 12, 2005 17. Yucaipa, M = 4.9 - 5.2, June 16, 2005 18. Obsidian Butte, M = 5.1, Sept. 2, 2005 CL#03-2015 Plot of Log10(Seismic Potential) Increase in Potential for significant events, ~ 2000 to 2010
Streaming Data Support Transformations Data Checking Hidden MarkovDatamining (JPL) Display (GIS) Grid Workflow Datamining in Earth Science NASA GPS • Work with Scripps Institute • Grid services controlled by workflow process real time data from ~70 GPS Sensors in Southern California Earthquake
Use a Portlet-based user portal to access and control services and workflow Grid Workflow Data Assimilation in Earth Science • Grid services triggered by abnormal events and controlled by workflow process real time data from radar and high resolution simulations for tornado forecasts
Beijing Xi’an Shanghai Hong Kong Hefei Changsha China National Grid From Qian Depei Beihang
New drug discovery grid • Undertaken by Shanghai Institute of Materia Medica CAS • Compound screening for new drug discovery • Speed up the process by computer simulation • Higher accuracy • Using HPC in P2P mode • New drug for diabetes is under development and will enter clinic testing by the end of 2005
曙光4 0 0 0 A 神 威 PC 机 群 神威 PC 机群 神 威 机 群 Beijing Medical Institute Shanghai SCC PC Shanghai Institute of Materia Medica CAS New Drug Discovery Grid Platform 主服务 器
Bio-informatics Grid • Undertaken by Genomics & Bioinformatics Institute, CAS • Provide computing, data, and information grids for bio-information research in the country
ChinaGrid (from Hai Jin) Huazhong University of Science and Technology Wuhan, China
ChinaGrid in a Nutshell • China Education and Research Grid • Funded by Ministry of Education • As the pilot grid application supported by China National Grid (CNGrid) • Based on CERNET (China Education and Research Network) • First Phase • From 2003-2005 • 12 key universities as initiative • 20 key universities now
BioGrid Applications • Protein target selection for rice genome • Multi-sequence alignment for ganoderma family • Gene joint for white mice • Cardiovascular disease research
Chemical Informatics and Cyberinfrastructure Collaboratory CICC Grid Vision • Drug Discovery and other academic chemistry and pharmacologyresearch will be aided by powerful modern information technology ChemBioGrid set up as distributed cyberinfrastructure in eScience model • ChemBioGrid will provide portals (user interfaces) to distributed databases, results of high throughput screening instruments, results of computational chemical simulations and other analyses • ChemBioGrid will provide services to manipulate this data and combine in workflows; it will have convenient ways to submit and manage multiple jobs • ChemBioGrid will include access to PubChem, PubMed, PubMed Central, the Internet and its derivatives like Microsoft Academic Live and Google Scholar • The services include open-source software like CDK, commercial code from vendors from BCI, OpenEye, Gaussian and Google, and any user contributed programs • ChemBioGrid will define open interfaces to use for a particular type of service allowing plug and play choice between different implementations • http://www.chembiogrid.org
Formal Cheminformatics Courses • I571 Chemical Information Technology (3 cr.) • Distance Ed section had 10 students in Fall 2005, from California to Connecticut • I572 Computational Chemistry and Molecular Modeling (3 cr.) • I573 Programming Techniques for Chemical and Life Science Informatics (3 cr.) • I553 Independent Study in Chemical Informatics (3 cr.) • Above courses required for the new Graduate Certificate Program in Chemical Informatics • I533 Seminar in Chemical Informatics • Spring 2006 Topic: Molecular Informatics, the Data Grid, and an Introduction to eScience • http://www.indiana.edu/~cheminfo/I533/533home.html • I647 Seminar in Chemical Informatics • Fall 2006 Topic: Bridging Bioinformatics and Chemical Informatics • http://www.indiana.edu/~cheminfo/I647/647home.html
Related Courses • L519 Bioinformatics: Theory and Application (3 cr.) (at IUPUI: CSCI 548) • L529 Bioinformatics in Molecular Biology and Genetics: Practical Applications (4 cr.) (not offered at IUPUI) • I619 Structural Bioinformatics (3 cr.) • I617 Informatics in Life Sciences and Chemistry (3 cr.) (for non-majors) • B649 Topics in Systems: Service Architectures and Science (3 cr.) • I590 Topics in Informatics: Scientific Applications of XML (IUPUI)
Total Grad Enrollment: Chem-, Lab, Bio-, Health Informatics, Fall 2005Red = Chem, Fall 2006
Next steps? • Define WSDL interfaces to enable global production of compatible Web services; refine CML • Ready to try “Prototype Production” • Develop more training material • Refine/go into production with key services including both tools, workflows and TeraGrid style simulations in capacity and capability modes • In-house algorithm work for new services in clustering, diversity analysis, QSAR methodologies CICC Prototype Web Services Basic cheminformatics Key Ideas Molecular weights Molecular formulae Tanimoto similarity 2D Structure diagrams Molecular descriptors 3D structures InChi generation/search CMLRSS • Add value to PubChem with additional distributed services and databases • Wrapping existing code in web services is not difficult • Provide “core” (CDK) services and exemplars of typical tools • Provide access to key databases via a web service interface • Provide access to major Compute Grids Application based services Compare (NIH) Toxicity predictions (ToxTree) Literature extraction (OSCAR3) Clustering (BCI Toolkit) Docking, filtering, ... (OpenEye)Varuna simulation
Web Service Locations Cambridge University • InChi generation / search • CMLRSS • OpenBabel Indiana University • Clustering • VOTables • OSCAR3 • Toxicity classification • Database services SDSCTypical TeraGrid Site InfoChem • SPRESI database NIH PubChem ….. Compare ….. Penn State University CDK based services • Fingerprints • Similarity calculations • 2D structure diagrams • Molecular descriptors
Workflows Using Chemical Literature Find similar documents Bulk download of Pubmed abstracts Find similar molecules All of PubMed “just” takes about a day to run through OSCAR3 on 2048 node Big Red PDBBind OSCAR3 Service OSCAR3 program PubChem Local DTP database Extract chemical structures SMILES NAME Pubmed ID CCC propane 1425356 CC ethane 3546453 ..... ............. ............. Searchable (structure/similarity) Grid database Clustering of documents linked to clustering of chemicals
Large Scale Calculations on “All of PubChem/Med” • TeraGrid: 100 Teraflop now to 1000 Teraflop next year • IU 2048 node Big Red supercomputer: 20 Teraflop today • The CDK can currently calculate approx. 107 Descriptors • Whole of PubChem (6M compounds) – 276 hours, 1 CPU • On IU's Big Red, 2048 CPU's, 20 TF: < 7 minutes • Even increasing the descriptor count by 5 times gives us < 35 minutes of compute time on Big Red • OSCAR3 takes a few seconds per abstract to text-mine all compounds in it • All of PubMed would take < a day on Big Red • Cleanup and Iteration would take some time • Can pre-calculate properties of smaller compounds using CDK (logP, BCUT, CPSA, …) and programs likes GAMESS • 100,000 compounds take < a week each on a single CPU and would be a practical computation over next year
Web Service to generate custom force fields Prototype CICC Project: Controlling the TGFb pathwayCollaboration between Baik & Zhang at IU Simulations in-house Molecules in Varuna QM Database AutoGeFF Can afford few ms overhead! TeraGridSupercomputers“Flocks” VARUNA Conceptual Understanding of TGFb Inhibition Inactive TGFb Active TGFb With inhibitor 1IAS • Questions: • - What molecular feature controls inhibitor binding? • - How do mutations impact binding? PubChem Experimentsin the Zhang Lab PDB
MLSCN Post-HTS Biology Decision Support Percent Inhibition or IC50 data is retrieved from HTS Grids can link data analysis ( e.g image processing developed in existing Grids), traditional Chem-informatics tools, as well as annotation tools (Semantic Web, del.icio.us) and enhance lead ID and SAR analysis A Grid of Grids linking collections of services atPubChem ECCR centers MLSCN centers Workflows encoding plate & control well statistics, distribution analysis, etc Question: Was this screen successful? Workflows encoding distribution analysis of screening results Question: What should the active/inactive cutoffs be? Question: What can we learn about the target protein or cell line from this screen? Workflows encoding statistical comparison of results to similar screens, docking of compounds into proteins to correlate binding, with activity, literature search of active compounds, etc Compounds submitted to PubChem PROCESS CHEMINFORMATICS GRIDS
MLSCN Data - How services and workflows are used PubChem interfaces to workflows via SOAP Data is stored in Pubchem MLSCN submits HTS data to Pubchem and/or sends directly to workflow for real-time feedback Workflows perform different kinds of analysis on the MLSCN data, including SAR, clustering, literature searching, protein searching, toxicity testing, etc… End-user applications and interfaces utilize the information streams from the workflows for human interaction with the data and analysis
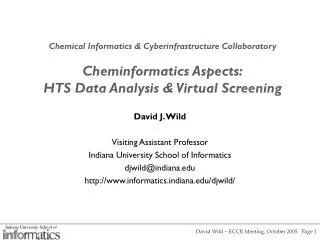
Example HTS workflow: finding cell-protein relationships A protein implicated in tumor growth with known ligand is selected (in this case HSP90 taken from the PDB 1Y4 complex) The screening data from a cellular HTS assay is similarity searched for compounds with similar 2D structures to the ligand. Docking results and activity patterns fed into R services for building of activity models and correlations LeastSquares Regression RandomForests NeuralNets Similar structures are filtered for drugability, are converted to 3D, and are automatically passed to the OpenEye FRED docking program for docking into the target protein. Once docking is complete, the user visualizes the high-scoring docked structures in a portlet using the JMOL applet. SImilar structures to the ligand can be browsed using client portlets.
Protein Function ubiquitination site Automated functional annotation Prediction of global functional class molecular function biological process cellular localization Prediction of residue based annotation post-translational modifications binding sites active sites deleterious mutations (disease implications) Inferences made from amino acid sequence protein 3D structure evolutionary data protein-interaction (network) data Molecular function: transcription regulator activity (GO:0030528) Predrag Radivojac www.informatics.indiana.edu/predrag