Download
1 / 14
221 likes | 479 Vues
‘Data Journalism’. Analyzing, Explaining & Visualizing Information. What Is ‘Data Journalism’?. The use of electronic records to find, support and explain stories Basic social science methods Tables, maps, docs, apps. Why Data Journalism?.

E N D
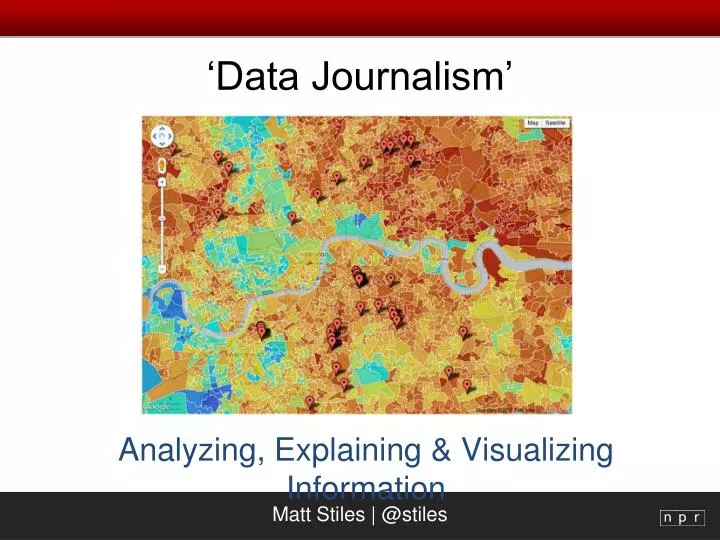
‘Data Journalism’ Analyzing, Explaining & Visualizing Information
What Is ‘Data Journalism’? The use of electronic records to find, support and explain stories Basic social science methods Tables, maps, docs, apps
Why Data Journalism? Our world is data-driven. Our news should be, too. Less ‘He said’, ‘She said’ Find important stories that can’t be found with traditional reporting methods
First, Find The Right Tool Story type: Print, online, broadcast? What’s the need: Data queries, visualization, maps, text analysis? Data, table structure: Should it be cleaned, reorganized, normalized before you begin any analysis?
Basic Data Journalist Tools Spreadsheets: Excel, Calc Databases: Access, MySQL, Base Mapping: ArcGIS, QGIS Statistics: SPSS, SAS, R Online: Google, ‘Hidden’ Web
Online Data Journalist Tools Data Analysis: Fusion Tables, Google Refine, MS Web Apps, Google Docs Visualization: Many Eyes, Tableau Public, Google Charts, Highcharts, D3 Mapping: OpenHeatMap, Tableau, Fusion Tables, GeoCommons, QGIS Text: DocumentCloud, xpdf
Story Examples: Lobbying Story: Lawmakers get free meals, gifts Source: Ethics database Tool: Simple MS Access queries Note: Lobbyists work on all topics
Story Examples: Campaign Finance Story: $60 million in donations in decade Source: Campaign finance database Tool: Access queries, Excel cleaning Note: Donors spend on all topics
Tool Examples: Fusion Tables • Free scalable database manager, maps in the cloud • Query, merge, visualize large data sets Crime | Fracking
App Examples: Texas Drought • Custom built app with open-source tools • Combined data, narrative content • Super ‘sticky’
Data Journalism Tips • Data journalism isn’t ‘magic’ • Know FOIA, but try to avoid it • Learn to harvest data on your beat • Use the hidden web • Start small and build your skills
Find Help… NICAR-L IRE ‘boot camps’ ‘Data Journalism Handbook’ ‘Computer-Assisted Reporting’
Find Inspiration… FlowingData.com InformationIsBeautiful.net ‘The Visual Display of Quantitative Information’ – Edward Tufte TheDailyViz.com
THANKS!Download Slides:http://bit.ly/pressdataQuestions/Help:mstiles@npr.org