Download
1 / 1
10 likes | 95 Vues
98 86 98 88 95 59 64 55 91 92 76 79 95 98 85 83 91 99 80 77 68. Step 1 – Order the series of numbers from least to greatest. Box and Whisker Plots 50%. 55 59 64 68 75 76 77 79 80 83 85 86 88 91 91 92 95 95 98 98 98 99.

E N D
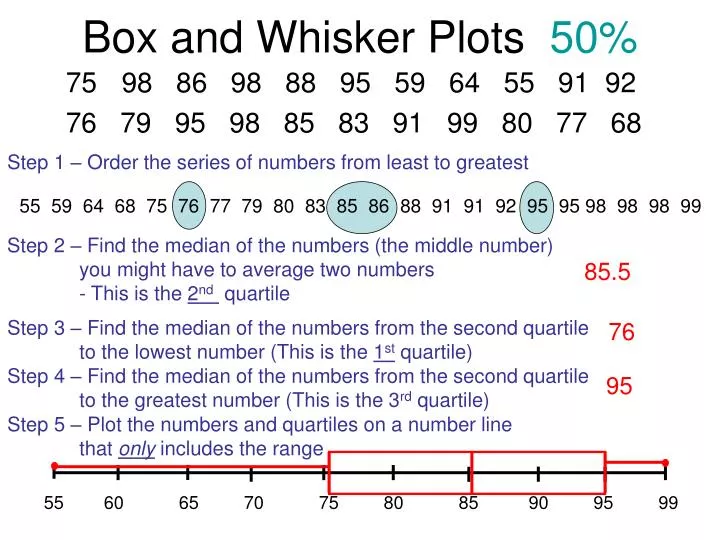
98 86 98 88 95 59 64 55 91 92 • 76 79 95 98 85 83 91 99 80 77 68 Step 1 – Order the series of numbers from least to greatest Box and Whisker Plots 50% 55 59 64 68 75 76 77 79 80 83 85 86 88 91 91 92 95 95 98 98 98 99 Step 2 – Find the median of the numbers (the middle number) you might have to average two numbers - This is the 2nd quartile 85.5 Step 3 – Find the median of the numbers from the second quartile to the lowest number (This is the 1st quartile) 76 Step 4 – Find the median of the numbers from the second quartile to the greatest number (This is the 3rd quartile) 95 Step 5 – Plot the numbers and quartiles on a number line that only includes the range 55 60 65 70 75 80 85 90 95 99