Download

1 / 24
250 likes | 268 Vues
Data of Macroeconomics. Xu Hu Texas A&M University. Outline. GDP -Real GDP -Nominal GDP -GDP Deflator CPI Unemployment Rate. Real vs. nominal GDP. GDP is the value of all final goods and services produced.

E N D
Data of Macroeconomics Xu Hu Texas A&M University
Outline • GDP -Real GDP -Nominal GDP -GDP Deflator • CPI • Unemployment Rate
Real vs. nominal GDP • GDP is the value of all final goods and services produced. • nominal GDP measures these values using current prices. • real GDPmeasure these values using the prices of a base year.
Example 1: • Compute nominal GDP in each year. • Compute real GDP in each year using 2006 as the base year.
Nominal GDP • nominal GDPmultiply Ps & Qs from same year2006: $46,200 = $30 900 + $100 192 2007: $51,400 = $31 1000 + $102 200 2008: $58,300 = $36 1050 + $100 205
Real GDP • real GDPmultiply each year’s Qs by 2006 Ps2006: $46,200 = $30 900 + $100 192 2007: $50,000 = $30 1000 + $100 2002008: $52,000 = $30 1050 + $100 205
Real GDP controls for inflation Changes in nominal GDP can be due to: • changes in prices. • changes in quantities of output produced. Changes in real GDP can only be due to changes in quantities, because real GDP is constructed using constant base-year prices.
Example 2: Decreasing Increasing
U.S. Nominal and Real GDP, 1950–2006 Real GDP(in 2000 dollars) Nominal GDP
GDP Deflator • The inflation rateis the percentage increase in the overall level of prices. • One measure of the price level is the GDP deflator, defined as
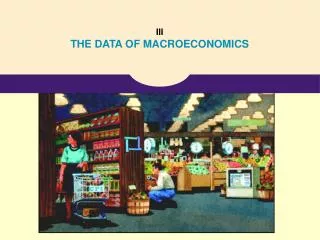
Consumer Price Index (CPI) • A measure of the overall level of prices • Published by the Bureau of Labor Statistics (BLS) • Uses: • tracks changes in the typical household’s cost of living • adjusts many contracts for inflation • allows comparisons of dollar amounts over time
How the BLS constructs the CPI 1. Survey consumers to determine composition of the typical consumer’s “basket” of goods. 2. Every month, collect data on prices of all items in the basket; compute cost of basket 3. CPI in any month equals
Example: Compute the CPI Basket contains 20 pizzas and 10 compact discs. For each year, compute • the cost of the basket • the CPI (use 2002 as the base year) • the inflation rate from the preceding year prices: pizza CDs 2002 $10 $15 2003 $11 $15 2004 $12 $16 2005 $13 $15
Basket contains 20 pizzas and 10 compact discs. Prices: pizza CDs 2002 $10 $15 2003 $11 $15 2004 $12 $16 2005 $13 $15 Cost of Inflation basket CPI rate 2002 $350 100.0 n.a. 2003 370 105.7 5.7% 2004 400 114.3 8.1% 2005 410 117.1 2.5%
CPI : Housing base year 1982-84 CPI : all items base year 1982-84 CPI : Food & Beverage base year 1982-84 CPI : Transportation base year 1982-84
CPI vs. GDP Deflator prices of capital goods • included in GDP deflator (if produced domestically) • excluded from CPI prices of imported consumer goods • included in CPI • excluded from GDP deflator the basket of goods • CPI: fixed • GDP deflator: changes every year
Two measures of inflation in the U.S. Percentage change from 12 months earlier
Categories of the population • employed working at a paid job • unemployed not employed but looking for a job • labor force the amount of labor available for producing goods and services; all employed plus unemployed persons • not in the labor forcenot employed, not looking for work
Two important labor force concepts • unemployment rate percentage of the labor force that is unemployed • labor force participation rate the fraction of the adult population that “participates” in the labor force
Example: Compute labor force statistics U.S. adult population by group, June 2006 Number employed = 144.4 million Number unemployed = 7.0 million Adult population = 228.8 million Use the above data to calculate • the labor force • the number of people not in the labor force • the labor force participation rate • the unemployment rate
data: E = 144.4, U = 7.0, POP = 228.8 • labor forceL = E +U = 144.4 + 7 = 151.4 • not in labor forceNILF = POP– L = 228.8 – 151.4 = 77.4 • unemployment rateU/L x 100% = (7/151.4) x 100% = 4.6% • labor force participation rateL/POP x 100% = (151.4/228.8) x 100% = 66.2%