Download
1 / 45
470 likes | 665 Vues
14. GOVERNMENT, THE ECONOMY, AND THE ENVIRONMENT. Chapter Outline. Economic Systems Power and Authority Political Behavior in the United States Models of Power Structure in the United States The Changing Economy The Environment Social Policy : Affirmative Action. Economic Systems.

E N D
14 GOVERNMENT, THE ECONOMY, AND THE ENVIRONMENT
Chapter Outline • Economic Systems • Power and Authority • Political Behavior in the United States • Models of Power Structure in the United States • The Changing Economy • The Environment • Social Policy: Affirmative Action
Economic Systems • Capitalism • Capitalism is an economic system in which the means of production are largely in private hands, and the main incentive for economic activity is the accumulation of profits. • Laissez-faire – people could compete freely with minimal government intervention. • Modern capitalism tolerates monopolistic practices.
Economic Systems • Socialism • The theory of socialism was refined by Marx and Engles. • Socialism attempts to eliminate economic exploitation. • Under socialism, the means of production and distribution are collectively rather than privately owned. • The objective of socialism is to meet people’s needs rather than maximize profits.
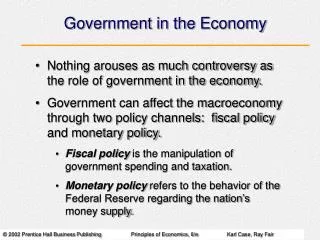
Power and Authority • Power • Weber argued that power is the ability to exercise one’s will over others. • Sources of power in political systems include: force influence authority
Power and Authority • Types of Authority • Authority is power that has been institutionalized and is recognized by the people over whom it is recognized.
Power and Authority • Types of Authority Traditional Authority: In traditional authority, legitimate power is conferred by custom and accepted practice. Legal-Rational Authority: In legal-rational authority, power is made legitimate by law. Charismatic Authority: In charismatic authority, power is made legitimate by a leader’s exceptional personal or emotional appeal to his or her followers.
Political Behavior in the United States • Political Socialization • Political socialization is the process by which one acquires political attitudes and develops patterns of political behavior. • The principal institutions of political socialization are: • the family the schools the media
Political Behavior in the United States • Participation and Apathy • Most citizens do not participate in political organizations on local or national levels. • Only 8 percent of people in the United States belong to a political club or organization. • Not more than 20 percent have ever contacted an elected official regarding an issue or problem.
Political Behavior in the United States Table 14.1: Political Party Preferences in the United States
(Population 18 and older, in millions) 203 186 92 76 130 19 Non-votingpopulation Votingpopulation 111 111 111 Totalpopulation Citizenpopulation Registeredpopulation Political Behavior in the United States Voter Turnout: 2000 Source: Figure 1 in Annie Jamieson et al. for the Bureau of the Census. 2002. Voting and Registration in the Election of November 2000. Current Population Reports Series P20-542. Washington, DC: U.S. Government Printing Office. Also accessible at http://www.census.gov/prod/2002pubs/p20-542.pdf.
(Population 18 and older, in millions) Number voted Percent ofregisteredvotersvoting Number registered but not voting Year 85.5 110.8 2000 18.7 82.3 1996 105.0 22.6 113.9 90.0 1992 12.7 86.2 1988 102.2 16.4 14.2 87.7 1984 101.9 88.6 1980 93.1 12.0 86.7 1976 88.7 11.1 12.7 87.1 1972 85.8 79.0 91.2 1968 7.6 Political Behavior in the United States Voting in Presidential Elections: 1918--2000 Source: Figure 3 in Annie Jamieson et al. for the Bureau of the Census. 2002. Voting and Registration in the Election of November 2000. Current Population Reports Series P20-542. Washington, DC: U.S. Government Printing Office. Also accessible at http://www.census.gov/prod/2002pubs/p20-542.pdf.
Proportion not citizensin the voting-agepopulation 2.2 Whitenon-Hispanic 60.4 61.8 Voting rate basedon voting-agepopulation 86.4 5.7 53.5 Black 56.8 84.2 Voting rate basedon voting-age, citizenpopulation 41.3 25.4 Asian andPacific Islander 43.3 82.8 Voting rate basedon voting-age, citizen,registered population 39.1 Hispanic(of any race) 27.5 45.1 78.6 Political Behavior in the United States Citizenship and Voting Rate by Race and Ethnicity: 2000 Source: Figure 2 in Annie Jamieson et al. for the Bureau of the Census. 2002. Voting and Registration in the Election of November 2000. Current Population Reports Series P20-542. Washington, DC: U.S. Government Printing Office. Also accessible at http://www.census.gov/prod/2002pubs/p20-542.pdf.
(Percent who voted of the voting-age citizen population) 72.2 70.1 66.5 66.3 60.5 50.5 36.1 18 to 24 25 to 34 35 to 44 45 to 54 55 to 64 65 to 74 75 and over Political Behavior in the United States Voting by Age: 2000 Source: Figure 4 in Annie Jamieson et al. for the Bureau of the Census. 2002. Voting and Registration in the Election of November 2000. Current Population Reports Series P20-542. Washington, DC: U.S. Government Printing Office. Also accessible at http://www.census.gov/prod/2002pubs/p20-542.pdf.
(Percent who voted of the voting-age citizen population) 81.9 75.4 63.1 52.5 39.3 38.0 Less than9th grade 9th to12th grade,no diploma Highschoolgraduate Somecollege orassociatedegree Bachelor’sdegree Advanceddegree Political Behavior in the United States Voting by Educational Attainment: 2000 Source: Figure 5 in Annie Jamieson et al. for the Bureau of the Census. 2002. Voting and Registration in the Election of November 2000. Current Population Reports Series P20-542. Washington, DC: U.S. Government Printing Office. Also accessible at http://www.census.gov/prod/2002pubs/p20-542.pdf.
(Percent who voted of the voting-age citizen population) Too busy 20.9 14.8 Illness or emergency 12.2 Not interested 10.2 Out of town 10.2 Other reason Didn’t like candidates 7.7 7.5 Refused, don’t know 6.9 Registration problems 4.0 Forgot 2.6 Inconvenient 2.4 Transportation problems Bad weather 0.6 Political Behavior in the United States Reason Given for Not Voting: 2000 Source: Figure 8 in Annie Jamieson et al. for the Bureau of the Census. 2002. Voting and Registration in the Election of November 2000. Current Population Reports Series P20-542. Washington, DC: U.S. Government Printing Office. Also accessible at http://www.census.gov/prod/2002pubs/p20-542.pdf.
Political Behavior in the United States • Women in Politics • Women are significantly underrepresented in government in the United States. • In 1999, there were 67 women in Congress, accounting for 58 of the 435 members of the House and 9 of the 100 members of the Senate. • Often, women in office or running for office are treated differently than men by the media.
Political Behavior in the United States Women in National Legislatures
Political Behavior in the United States Anti-Tobacco Vote and Campaign Contributions
Models of Power Structure in the United States • Power Elite Models • Mills’s Model • --Mills described a small ruling elite of military, industrial, and governmental leaders. • --Power rested in the hands of a few, inside and outside of government….the power elite. • --The power elite are mostly male, white, and upper class.
Models of Power Structure in the United States • Power Elite Models • Domhoff’s Model • --This model stresses the roles played by elites of the corporate community and the leaders of policy-formation organizations such as: chambers of commerce labor unions
Models of Power Structure in the United States Figure 14.1: Power Elite Models
Models of Power Structure in the United States • Pluralist Model • According to the pluralist model, many conflicting groups within the community have access to government, so that no single group is dominant. • A variety of groups play a significant role in decision making.
The Changing Economy • The Face of the Workforce • Sociologists foresee a workforce increasingly composed of women and racial and ethnic minorities. • A more diverse workforce means relationships between workers are more likely to cross gender, racial, and ethnic lines.
The Changing Economy Figure 14.2: Racial and Ethnic Composition of the U.S. Labor Force, 1986 and 2008
Income in 2000 dollars Recession 40,000 $37,339 35,000 Male, full-time,year-round workers $31,040 30,000 $27,355 Male, total workers 25,000 Female, full-time,year-round workers $20,311 20,000 15,000 Female, total workers 10,000 5,000 0 1967 1970 1973 1976 1979 1982 1985 1988 1991 1994 1997 2000 The Changing Economy Median Earnings of Workers 15 Years Old and Over by Work Experience and Sex: 1967--2000 Source: Carmen DeNavas-Walt, Robert W. Cleveland, and Marc L. Oemer. 2001. Figure 3 in Money Income in the United States: 2000. Current Population Reports Series P60-213. Washington, DC: U.S. Government Printing Office. Also accessible at http://www.census.gov/hhes/www/income00.html.
$4,680 (Average earnings indollars for peopleemployed full-timefor the previous4 months) $3,208 Engineering $3,046 $4,416 Computers $2,996 $3,962 $2,727 Business $2,373 $3,645 $2,783 Science $2,412 Bachelor’sdegree $3,455 Liberal Arts $2,586 $3,292 Social Science Associatedegree $2,660 Education $2,802 Vocationalcertificate Vocationalstudies $3,197 $2,429 $3,808 $2,804 Other $2,578 The Changing Economy Monthly Earnings by Field of Training for Selected Education Levels: 1996 Source: U.S. Bureau of the Census. 2001. The Population Profile of the United States: 2000. Figure 9-3. (Internet Release) accessed at http://www.census.gov/population/www/pop-profile/profile2000.html#cont.
The Changing Economy • Deindustrialization • Deindustrialization is the systematic, widespread withdrawal of investment in the basic aspects of productivity such as factories and plants. • Downsizing is a reduction in a company’s workforce.
The Changing Economy • E-Commerce • E-commerce is a term for the numerous ways that people with access to the Internet can do business from their computers. • The growth of e-commerce means jobs in a new line of industry as well as growth for related industries.
The Changing Economy • The Contingency Workforce • With downsizing and deindustrialization, a contingency workforce has developed, in which workers are hired only for as long as they are needed. • The contingency workforce has been termed the temping of America. • According to one estimate, contingency workers constitute about one-fourth of the nation’s paid labor force.
The Environment • Environmental Problems: An Overview • Air Pollution • --In cities, air pollution is primarily caused by automobiles and emissions from electric power plants and heavy industries. • --The World Health Organization estimates that up to 700,000 premature deaths per year could be prevented if pollutants were brought to safer levels.
1.8 1.6 1.4 1.2 1.0 Nitrogen oxides 0.8 0.6 0.4 Sulfur dioxide 0.2 0.0 1920 1930 1940 1950 1960 1970 1980 1990 1900 1910 The Environment Sulfur Dioxide and Nitrogen Oxide Emissions per Unit of GNP Since 1900 Source: Office of the President. 2000. Economic Report of the President: Transmitted to the Congress, February 2000. Washington, DC: U.S. Government Printing Office, p. 242.
The Environment • Environmental Problems: An Overview • Water Pollution • --Dumping of waste materials by industries and local governments has polluted streams, rivers, and lakes. • --Many bodies of water are now unsafe for drinking, fishing, and swimming. • --Pollution of the oceans are now becoming a major concern.
The Environment • Environmental Problems: An Overview • Contamination of Land • --A significant part of land contamination comes from the tremendous demand for landfills to handle the nation’s waste.
The Environment The Impact of Global Warming
The Environment • Functionalism and Human Ecology • The natural environment serves three basic functions for humans: • The environment provides the resources essential for life. • The environment serves as a waste repository. • The environment houses our species.
The Environment • Conflict View of Environmental Issues • Less affluent nations are being forced to exploit their mineral deposits, forests, and fisheries to meet debt obligations. • The poor turn to the only means of survival available to them: plow mountain slopes burn plots in rain forests overgraze grasslands
The Environment • Conflict View of Environmental Issues • Western industrialized nations account for 25 percent of the world’s population. • Western industrialized nations are responsible for 85 percent of worldwide consumption.
Social Policy and the Economy • Affirmative Action • The Issue • --1961 executive order issued by J. F. Kennedy called for contractors to “take affirmative action to ensure that applicants are employed, and that employees are treated during employment, without regard to their race, creed, color, or national origin.” • --Currently, affirmative action refers to positive efforts to recruit minority group members or women for jobs, promotions, and educational opportunities.
Social Policy and the Economy • Affirmative Action • The Setting • --Discriminatory actions currently outlawed include: • Discrimination based on race, sex, or both • Word-of-mouth recruitment among all-White or all-male workforces • Recruitment exclusively in schools or colleges that are limited to one sex or are predominantly White • Discrimination against married and/or pregnant women • Advertising in male and female help wanted columns when gender is not an occupational qualification • Job qualifications and tests that are unrelated to the job
Social Policy and the Economy Figure 14.3: U.S. Median Income by Race, Ethnicity, and Gender, 1999
Social Policy and the Economy Minority-Owned Firms as a Percent of Total Firms in State: 1997 Source: U.S. Bureau of the Census. 2001. Minority-Owned Business Enterprises. 1997Economic Census. Slide 17 accessed at http://www.census.gov/csd/mwb/Minorityp.htm.
Social Policy and the Economy • Affirmative Action • Sociological Insights • --Conflict theorists view affirmative action as a legislative attempt to reduce the inequality embedded in the social structure by increasing the opportunities of groups that have been deprived in the past. • --Interactionists focus on situations in which some women and minorities in underrepresented professions and schools are often mistakenly viewed as products of affirmative action.
Social Policy and the Economy • Affirmative Action • Policy Initiatives • --Opponents of affirmative action insist that its goals are, in fact, quotas that lead to reverse discrimination. • --A 1996 California measure prohibited any program that gives preference to women and minorities in college admissions, hiring, promotion, or government contracts. It aims to abolish affirmative action. • --The United States is not alone in its struggle to find acceptable ways of compensating for generations of inequality between racial groups.