Download

1 / 20

E N D
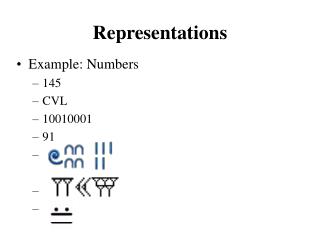
Matrix Representations Lesson 6.1
On Saturday, Karina surveyed visitors to Snow Mountain with weekend passes and found that 75% of skiers planned to ski again the next day and 25% planned to snowboard. Of the snowboarders, 95% planned to snowboard the next day and 5% planned to ski. In order to display the information, she made this diagram.
The arrows and labels show the patterns of the visitors’ next-day activities. • For instance, • the circular arrow labeled 0.75 indicates that 75% of the visitors skiing one day plan to ski again the next day. • The arrow labeled 0.25 indicates that 25% of the visitors who ski one day plan to snowboard the next day.
Diagrams like these are called transition diagrams because they show how something changes from one time to the next. • The same information is sometimes represented in a transition matrix.
A matrix is a rectangular arrangement of numbers. For the Snow Mountain information, the transition matrix looks like this:
Chilly Choices • The school cafeteria offers a choice of ice cream or frozen yogurt for dessert once a week. During the first week of school, 220 students choose ice cream but only 20 choose frozen yogurt. During each of the following weeks, 10% of the frozen yogurt eaters switch to ice cream and 5% of the ice-cream eaters switch to frozen yogurt. • Complete a transition diagram that displays this information.
Complete a transition matrix that represents this information. The rows should indicate the present condition, and the columns should indicate the next condition after the transition.
In the second week, how many students choose ice cream and how many students choose frozen yogurt? • How many students will choose each option in the third week? Let u1 represent ice-cream eaters, and let u2 represent frozen yogurt eaters u1(2)=220(0.95)+20(0.10)=211 u2(2)=220(0.05)+20(0.90)=29 u1(3)= =211(0.95)+29(0.10)=203 u2(3)= 211(0.05)+29(0.90)=37
Write a recursive routine to take any week’s values and give the next week’s values. • What do you think will happen to the long-run values of the number of students who choose ice cream and the number who choose frozen yogurt? u1(1)=220 and u2(1)= 20 u1(n)= u1(n-1)(0.95) + u2(n-1)(0.10) where n ≥ 2 u2(n)= u1(n-1)(0.05) + u2(n-1)(0.90) where n ≥ 2 Ice-cream eaters will approach 160, and frozen-yogurt eaters will approach 80.
On the Calculator • Open a Graph Window • Locate your cursor at the bottom left of the screen and then press MENU and select Graph Type, 5. Sequence, 1. Sequence. • Fill in u1(n)= u1(n-1)(0.95) + u2(n-1)(0.10) Initial Term: 220 • Then enter a second sequence:u2(n)= u1(n-1)(0.05) + u2(n-1)(0.90)Initial Term: 20 • Press Menu, Window/Zoom and select Zoom-Fit
Make an observation about what happens eventually with both sequences.
Add a List and Spreadsheet page. In column A generate a sequence in the grey row: =seqn(u(n-1)+1,{1},90) In column B generate a sequence in the grey row: =seqn(u1(n),{220},90) In column C generate a sequence in the grey row: =seqn(u2(n),{20},90) What do two columns B and C indicate?
From a graph screen generate two sequences. A set of table values can be viewed by pressing Control T. What do the table values and graphs illustrated?
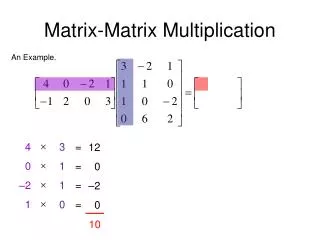
The dimensions of the matrix give the numbers of rows and columns, in this case, 3x2 (read “three by two”). • Each number in the matrix is called an entry, or element, and is identified as a ij , where i and j are the row number and column number, respectively. • In matrix [A] at right, a31=98 because 98 is the entry in row 3, column 1.
Example A • Represent quadrilateral ABCD as a matrix, [M]. • You can use a matrix to organize the coordinates of the consecutive vertices of a geometric figure. • Since each vertex has 2 coordinates and there are 4 vertices, use a 2x4 matrix with each column containing the x- and y-coordinates of a vertex. Row 1 contains consecutive x-coordinates and row 2 contains the corresponding y-coordinates.
Example B • In Karina’s survey from the beginning of this lesson, she interviewed 260 skiers and 40 snowboarders.
Example B • How many people will do each activity the next day if her transition predictions are correct? • The next day, 75% of the 260 skiers will ski again and 5% of the 40 snowboarders will switch to skiing. • Skiers: 260(0.75)+40(0.05)=197 • So 197 people will ski the next day.
Example B • How many people will do each activity the next day if her transition predictions are correct? • The next day, 25% of the 260 skiers will switch to snowboarding and 95% of the 40 snowboarders will snowboard again. • Snowboarders: 260(0.25)+40(0.95)=103 • So 103 people will snowboard the next day.
You can organize the information for the first day and second day as matrices in the form