Download
1 / 32
320 likes | 449 Vues
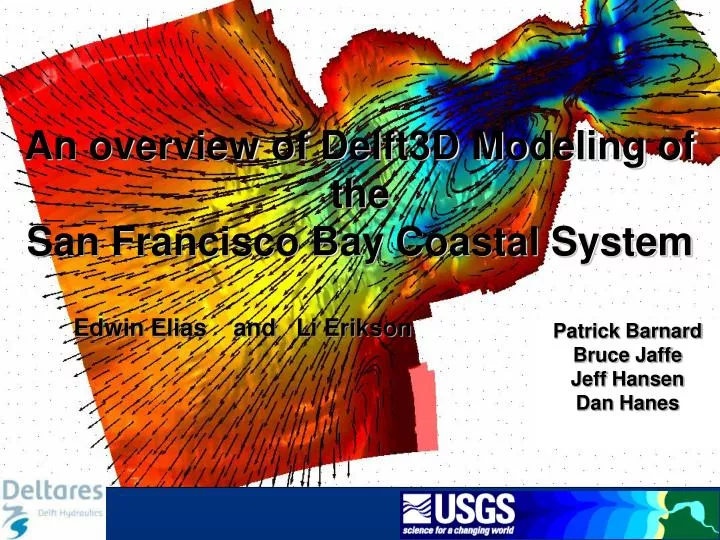
An overview of Delft3D Modeling of the San Francisco Bay Coastal System Edwin Elias and Li Erikson. Patrick Barnard Bruce Jaffe Jeff Hansen Dan Hanes. Introduction. USGS interest Delft3D Model system General introduction into the San Francisco Bay model

E N D
An overview of Delft3D Modeling of the San Francisco Bay Coastal System Edwin Elias and Li Erikson Patrick Barnard Bruce Jaffe Jeff Hansen Dan Hanes
Introduction • USGS interest • Delft3D Model system • General introduction into the San Francisco Bay model • Detailed studies: • Long term ebb-tidal delta • San Pablo Bay • Golden Gate area • Ocean Beach • Crissy Marsh Inlet
Introduction • USGS interest…. • What are the dominant sediment transport • pathways? • - San Francisco Bay Coastal System • - Ocean Beach • - Dredge disposal sites • - Large sand wave fields • - Crissy Marsh Inlet • (2) Long-term evolution of San Pablo and Suison Bay • (3) What is the cause of observed ebb tidal • delta constriction? • (4) What is the cause of the erosional hot spot • at Ocean Beach? • - Sediment supply? • - Wave refraction/focusing patterns? • - Tidal current patterns?
Modeling Strategy • Use existing tools to do the job • Ability to run this on desktop computers • Selected : Delft3D modeling system • Construct a base model • - Limited in resolution • - Validated on hydrodynamics • - Provides boundary conditions • for detailed studies • Create detailed models • for each project • Add complexity where needed Scale Cascade (de Vriend, 1998) Sand waves Sediment budget ETD Ocean Beach SF BAY evolution
Coastal Morphodynamic Modeling using Delft3D • Cartesian and spherical co-ordinates • 2D and 3D (σ or fixed layers in the vertical) • salinity and temperature • Online Morphology • turbulence closure (incl. k-L and k-E) models • drying and flooding • sediment and morphology • Dredging and dumping • Rain fall and evaporation • Thermal discharge and heat fluxes • drogue tracks • domain decomposition • Wave – Current interactions • Particle tracking • Sediment tracking
Coastal Morphodynamic Modeling using Delft3D • Waves: • SWAN (40.72) • XBeach • Processes: • enhanced bed shear stress • wave forcing due to breaking • wave-induced mass flux • additional turbulence • wave streaming:
Coastal Morphodynamic Modeling using Delft3D • Multiple sediment fractions • Bed stratigraphy • Transport Formulations • Non Cohesive • Van Rijn (1984,1993,2004,2010) • Engelund-Hansen (1967) • Meyer-Peter-Muller (1948) Bijker (1971) • Soulsby/van Rijn • Cohesive • Partheniades & Krone (default) • Slib3d • Morphological Acceleration:
Delft3D Base Model Set up FLOW grid Single domain model application
Domain Decomposition and schematized Delta • Domain Decomposition application (25000 cells) • Run time: 1 month 2dh hydrodynamics • 1.5 hours (on a 2.66 Ghz Quad Core machine
Domain Decomposition and schematized Delta • Domain Decomposition application (25000 cells) • Run time: 1 month 2dh hydrodynamics • 1.5 hours (on a 2.66 Ghz Quad Core machine
SWAN Setup • Four nested grids with • 500 m, 200 m, 100 m, • and 25 m resolution • CDIP buoy #029 data • used to force model • on 3 open boundaries • (2D MEM Spectra) • Current grid generated • with Delft3D flow model
SF water level Ocean Beach water level Depth (m)
Velocities at Crissy Marsh • MORE validation….. Velocities at Ocean Beach Swell at Crissy Marsh cm2/Hz/deg
Introduction • USGS interest • Delft3D Model system • General introduction into the San Francisco Bay model • Detailed studies: • Long term ebb-tidal delta • San Pablo Bay • Golden Gate area • Ocean Beach • Crissy Marsh Inlet
Long-term morphodynamic predictions Evolution of the San Francisco Ebb Tidal Delta Over the Past Half Century Observed Depth Change Model: T0 Model-reality consistencies: - Overall shape and orientation Asymmetry - Secondary Flood Channels WHY has the Ebb Tidal Delta contracted? (and what will happen in the future?)Several potential causes:(1) Change in sediment supply2) Rising sea level3) Tidal Prism change in SF Bay4) Increase in Pacific Ocean WavesPrerequisite: can the model approximately reproduce the observed delta? Measured 2004/2005 Model: Tides and Waves, 50 yr Model: Tides only, 50 yr
Long-term morphodynamic predictions Evolution of the San Francisco Ebb Tidal Delta Over the Past Half Century Observed Depth Change Measured 2004/2005 Model: Tides only, 50 yr
Long-term morphodynamic predictions Evolution of the San Francisco Ebb Tidal Delta Over the Past Half Century Observed Depth Change Measured 2004/2005 Model: Tides and Waves, 50 yr Model: Tides only, 50 yr
Long-term morphodynamic predictions Evolution of the San Francisco Ebb Tidal Delta Over the Past Half Century Observed Depth Change WHY has the Ebb Tidal Delta contracted? (and what will happen in the future?)Several potential causes:(1) Change in sediment supply2) Rising sea level3) Tidal Prism change in SF Bay4) Increase in Pacific Ocean WavesPrerequisite: can the model approximately reproduce the observed delta? Higher Sea Level > ETD Contraction Shallower Bay > ETD Contraction Deeper Bay > ETD Expansion 100 year long simulations with tide only
Hindcasting bathymetric change in San Pablo Bay Mick van der Weegen (IHE) & Bruce Jaffe (USGS) Measured: 1877 1856 - 1877 Modeled: 1877 1856 - 1877 Residual sediment transport: Measured: 1856 Measured - Modeled: Wet period Dry period
Ocean – Bay interaction Understand the processes of flow and sediment transport in and around the San Francico Bay entrance Predicted mean flow – 1-month period Predicted sediment transport - ‘hydrodynamic tide’ Predicted flow over the sandwave area
Hot-spot erosion at Ocean Beach Jeff Hansen (USGS, Santa Cruz) The Alongshore Momentum Balance LHS A B C D LHS = Advective terms A= Pressure gradient, g= gravity B= Radiation stresses C=Bed shear stress D=Turbulent momentum flux (Reynolds stresses)
Flux through the Golden Gate LISST January 2008: collected synoptic sediment samples and CTD-LISST profiles and nearly continuous ADCP current measurements over a spring and neap tide along two transects across the Gate
Tide-induced transport Net bedload transport over morphodynamic tide
N C S 6 5 W E 3 1 4 2 2 Swell penetration through the Golden Gate Forcing: 2.0 m / direction sector Forcing: 5 m / direction sector
Swell penetration through the Golden Gate Boundary forcing Wave focusing past the GG 0o 270o 90o 180o
Summary • Models are available that can address sediment transports in SF Bay on a variety of spatial and temporal scales. • Ocean-bay interaction is critical for understanding sediment transport within San Francisco Bay ; You need to model bay – ocean – and probably the delta to get it right…. • Currently, sediment transport is inferred from fairly well validated hydrodynamics; for true calibration and validation of models, there is an urgent need for sediment transport and morphologic change measurements • However….it is not that simple….. • Changes in morphology are usually small; hence you need a look over a long-time frame to get a “realistic” estimate. • Modeling over these long-time frames is difficult especially if forcing processes and physical setting are complex. • Short term modeling can be more accurate, but instantaneous sediment measurements are costly, usually limited to a few locations, and inaccurate.
Future Directions • (better) Quantify sediment flux through the Golden Gate • 3D Modeling • San Francisco Bay Coastal System sediment budget http://walrus.wr.usgs.gov/coastal_processes/
Future Directions • Calibrate and validate a coupled ocean-bay-delta model (unstructured) • Operational (real-time/now cast) model • Use beyond sediment….. • Search and Rescue • Track and Trace (e.g. oil spills) • Rapid assessment model for disasters • Flood prediction http://walrus.wr.usgs.gov/coastal_processes/