Download

1 / 51
570 likes | 1.83k Vues
Prepared by Gregory K. Lowry Mercer University Marianne Bradford The University of Tennessee John Wiley & Sons, Inc. Financial Accounting, 4e Weygandt, Kieso, & Kimmel CHAPTER 15 FINANCIAL STATEMENT ANALYSIS After studying this chapter, you should be able to:

E N D
Prepared by Gregory K. Lowry Mercer University Marianne Bradford The University of Tennessee John Wiley & Sons, Inc. Financial Accounting, 4e Weygandt, Kieso, & Kimmel
CHAPTER 15FINANCIAL STATEMENT ANALYSIS After studying this chapter, you should be able to: 1 Discuss the need for comparative analysis. 2Identifythe tools of financial statement analysis. 3 Explain and apply horizontal analysis. 4Describe and apply vertical analysis.
CHAPTER 15FINANCIAL STATEMENT ANALYSIS After studying this chapter, you should be able to: 5 Identify and compute ratios and describe their purpose and use in analyzing a firm’s liquidity, profitability, and solvency. 6Understand the concept of earning power and indicate how material items not typical of regular operations are presented. 7 Recognize the limitations of financial statement analysis.
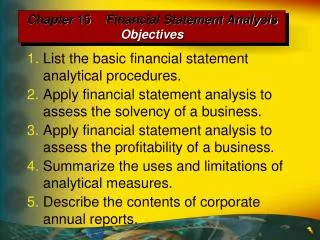
FINANCIAL STATEMENT ANALYSIS Horizontal and Vertical Analysis Earning Power and Irregular Items Basics of Financial Statement Analysis Limitations of Financial Analysis Ratio Analysis Need for comparative analysis Tools of analysis Balance sheet Income statement Retained earnings statement Liquidity Profitability Solvency Summary Estimates Cost Accounting methods Atypical data Diversification PREVIEW OF CHAPTER 15 Discontinued operations Extraordinary items Change in accounting principle Comprehensive income
BASICS OF FINANCIAL STATEMENT ANALYSIS • Analyzing financial statements involves Three characteristics of a company: 1its liquidity, 2 its profitability, and 3its solvency. • Every item reported in a financial statement has significance. • In order to obtain information as to whether the amount 1represents an increase over prior years or 2is adequate in relation to the company’s need for cash, the amount of cash must be compared with other financial statement data. • Comparisons can be made on several difference bases – threeare illustrated in this chapter: 1intracompany basis, 2industry averages, and 3intercompany basis.
TOOLS OF FINANCIAL STATEMENT ANALYSIS Three commonly used tools are utilized to evaluate the significance of financial statement data. 1Horizontal analysis (trend analysis) is a technique for evaluating a series of financial statement data over a period of time. 2Vertical analysis is a technique for evaluating financial statement data that expresses each item in a financial statement in terms of a percent of a base amount. 3Ratio analysis expresses the relationship among selected items of financial statement data.
ILLUSTRATION 15-1, 15-2 SEARS ROEBUCK’S NET SALES SEARS, ROEBUCK AND CO. The purpose of horizontal analysis is to determine the increase or decrease that has taken place, expressed as either an amount or a percentage. The recent net sales figures of Sears, Roebuck and Co. are shown above. Given that 1996 is the base year, we can measure all percentage increases or decreases from this base period amount as shown below. (Net Sales Stated in Millions) 2000 1999 1998 1997 1996 $ 40,937 $ 39,484 $ 39,953 $ 39,837 $ 36,662 Change since base period =
ILLUSTRATION 15-4 HORIZONTAL ANALYSIS OF SEARS, ROEBUCK’S NET SALES We can determine that net sales for Sears, Roebuck increased approximately 8.7% [($39,837 - $36,662) ÷ $36,662] from 1996 to 1997. We can also determine that net sales increased over 11.7% [($40,937 - $36,662) ÷ $36,662] from 1996 to 2000. The percentage of the base period for each of the 5 years, assuming 1996 as the base period, is shown below. Sears, Roebuck and Co. Net Sales (in Millions) Base Period 1996 2000 1999 1998 1997 1996 $40,937 $ 39,484 $ 39,953 $ 39,837 $36,662 111.7% 107.7% 109% 108.7% 100%
Increase or (Decrease) during 2000 Current assets $ 1,020,000 $ 75,000 7.9% Intangible assets 17,500 ( 2,500) ( 14.3%) $ 1,835,000 Current liabilities 13.7% 487,500 Total liabilities 800,000 32,000 Stockholders’ Equity 5,400 2.0% Retained earnings 1,003,000 208,000 Total liabilities and stockholders’ equity ILLUSTRATION 15-5 HORIZONTAL ANALYSIS OF A BALANCE SHEET The 2-year condensed balance sheet of Quality Department Store Inc. for 2000 and 1999 showing dollar and percentage changes is displayed on the right. In the asset section, plant assets (net) increased $167,500 or 26.5%. In the liabilities section, current liabilities increased $41,500 or 13.7%. In the stockholders’ equity section, retained earnings increased $202,600 or 38.6%. It appears the company expanded its asset base during 2000 and financed the expansion by retaining income in the firm. QUALITY DEPARTMENT STORE INC. Condensed Balance Sheet December 31 2000 1999 Amount Percentage Assets $ 945,000 Plant assets (net) 800,000 632,500 167,500 26.5% 15,000 Total assets $ 1,595,000 $ 240,000 15.0% Liabilities $ 344,500 $ 303,000 $ 41,500 Long-term liabilities 497,000 ( 9,500) ( 1.9%) 832,000 4.0% Common stock, $1 par 275,400 270,000 727,600 525,000 202,600 38.6% Total stockholders’ equity 795,000 26.2% $ 1,835,000 $ 1,595,000 $ 240,000 15.0%
ILLUSTRATION 15-6 HORIZONTAL ANALYSIS OF AN INCOME STATEMENT The 2-year comparative income statement of Quality Department Store Inc. for 2000 and 1999 is shown in condensed form on the right. Horizontal analysis of the comparative income statement shows the following changes: 1Net sales increased $260,000, or 14.2% ($260,000 ÷ $1,837,000). 2Cost of goods sold increased $141,000, or 12.4% ($141,000 ÷ $1,140,000). 3Total operating expenses increased $37,000, or 11.6% ($37,000 ÷ $320,000). QUALITY DEPARTMENT STORE INC. Condensed Income Statement For the Years Ended December 31 Increase or (Decrease) during 2000 2000 1999 Amount Percentage Sales $ 2,195,000 $ 1,960,000 $ 235,000 12.0% Sales returns and allowances 98,000 123,000 ( 25,000) ( 20.3%) Net sales 2,097,000 1,837,000 260,000 14.2% Cost of goods sold 1,281,000 1,140,000 141,000 12.4% Gross profit 816,000 697,000 119,000 17.1% Selling expenses 253,000 211,500 41,500 19.6% Administrative expenses 104,000 108,500 ( 4,500) ( 4.1%) Total operating expenses 357,000 320,000 37,000 11.6% Income from operations 459,000 377,000 82,000 21.8% Other revenues and gains Interest and dividends 9,000 11,000 ( 2,000) ( 18.2%) Other expenses and losses Interest expense 36,000 40,500 ( 4,500) ( 11.1%) Income before income taxes 432,000 347,500 84,500 24.3% Income tax expense 168,200 139,000 29,200 21.0% Net income $ 263,800 $ 208,500 $ 55,300 26.5%
ILLUSTRATION 15-7 HORIZONTAL ANALYSIS OF A RETAINED EARNINGS STATEMENT The 2-year comparative retained earnings statement of Quality Department Store Inc. for 2000 and 1999 is presented on the right. Analyzed horizontally: 1Net income increased $55,300, or 26.5%. 2Common dividends increased only $1,200, or 2%. 3Ending retained earnings increased 38.6%. QUALITY DEPARTMENT STORE INC. Retained Earnings Statement For the Years Ended December 31 Increase or (Decrease) during 2000 2000 1999 Amount Percentage Retained earnings, January 1 $ 525,000 $ 376,500 $ 148,500 39.4% Add: Net income 263,800 208,500 55,300 26.5% 788,800 585,000 203,800 Deduct: Dividends 61,200 60,000 1,200 2.0% Retained earnings, December 31 $ 727,600 $ 525,000 $ 202,600 38.6%
ILLUSTRATION 15-8 VERTICAL ANALYSIS OF A BALANCE SHEET Presented on the right is the 2-year comparative balance sheet of Quality Department Store Inc. for 2000 and 1999. 1Current assets increased $75,000 from 1999 to 2000, they decreased from 59.2% to 55.6% of total assets. 2Plant assets (net) increased from 39.7% to 43.6% of total assets, and 3Retained earnings increased from 32.9% to 39.7% of total liabilities and stockholders’ equity. These results reinforce earlier observations that Quality is financing its growth through retention of earnings. QUALITY DEPARTMENT STORE INC. Condensed Balance Sheet December 31 2000 1999 Amount Percent Amount Percent Assets Current assets $ 1,020,000 55.6% $ 945,000 59.2% Plant assets (net) 800,000 43.6% 632,500 39.7% Intangible assets 15,000 0.8% 17,500 1.1% Total assets $ 1,835,000 100.0% $ 1,595,000 100.0% Liabilities Current liabilities $ 344,500 18.8% $ 303,000 19.0% Long-term liabilities 487,500 26.5% 497,000 31.2% Total liabilities 832,000 45.3% 800,000 50.2% Stockholders’ Equity Common stock, $1 par 275,400 15.0% 270,000 16.9% Retained earnings 727,600 39.7% 525,000 32.9% Total stockholders’ equity 1,003,000 54.7% 795,000 49.8% Total liabilities and stockholders’ equity $ 1,835,000 100.0% $1,595,000 100.0%
ILLUSTRATION 15-9 VERTICAL ANALYSIS OF AN INCOME STATEMENT Vertical analysis of the 2-year comparative income statement of Quality Department Store Inc. for 2000 and 1999 is shown on the right. 1Cost of goods sold as a percentage of net sales declined 1% (62.1% versus 61.1%). 2Total operating expenses declined 0.4% (17.4% versus 17.0%). 3Net income as a percent of net sales therefore increased from 11.4% to 12.6%. Quality appears to be a profitable enterprise that is becoming more successful. QUALITY DEPARTMENT STORE INC. Condensed Income Statement For the Years Ended December 31 2000 1999 Amount Percent Amount Percent Sales $ 2,195,000 104.7% $ 1,960,000 106.7% Sales returns and allowances 98,000 4.7% 123,000 6.7% Net sales 2,097,000 100.0% 1,837,000 100.0% Cost of goods sold 1,281,000 61.1% 1,140,000 62.1% Gross profit 816,000 38.9% 697,000 37.9% Selling expenses 253,000 12.0% 211,500 11.5% Administrative expenses 104,000 5.0% 108,500 5.9% Total operating expenses 357,000 17.0% 320,000 17.4% Income from operations 459,000 21.9% 377,000 20.5% Other revenues and gains Interest and dividends 9,000 0.4% 11,000 0.6% Other expenses and losses Interest expense 36,000 1.7% 40,500 2.2% Income before income taxes 432,000 20.6% 347,500 18.9% Income tax expense 168,200 8.0% 139,000 7.5% Net income $ 263,800 12.6% $ 208,500 11.4%
ILLUSTRATION 15-10 INTERCOMPANY INCOME STATEMENT COMPARISON Vertical analysis enables you to compare companies of different sizes. Quantity’s major competitor is a Sears store in a town nearby town. Using vertical analysis, the small Quality Department Store Inc. can be meaningfully compared to the much larger Sears, as shown below. 1Gross profit rates were somewhat comparable at 38.9% and 34.3%. 2Income from operations percentages were significantly different at 21.9% and 5.3% . 3 Quality’s selling and administrative expenses percentage was much lower than Sears’ – 17% to 28.9%. 4 Sears’ net income as a percentage of sales was much lower than Quality’s: 3.3% to 12.6%. CONDENSED INCOME STATEMENTS Quality Department Sears, Roebuck Store Inc. And Co. (in thousands) Dollars Percent Dollars Percent Net sales $ 2,097 100.0% $ 46,937,000 100.0% Cost of goods sold 1,281 61.1% 26,899,000 65.7% Gross profit 816 38.9% 14,038,000 34.3% Selling and administrative expenses 357 17.0% 11,851,000 28.9% Income from operations 459 21.9% 2,187,000 5.3% Other expenses and revenues (including income taxes 195 9.3% 884,000 2.1% Net income $ 264 12.6% $ 1,343,000 3.3%
RATIO ANALYSIS • Ratio analysis expresses the relationship among selected items of financial statement data. • A ratio expresses the mathematical relationship between one quantity and another. • A single ratio by itself is not very meaningful, in the upcoming illustrations we will use: 1 Intracompany comparisons covering two years for the Quality Department Store. 2 Industry average comparisons based on median ratios for department stores 3 Intercompany comparisons based on Sears, Roebuck and Co. as Quality Department Store’s principal competitor.
Liquidity Ratios Measures of short-term ability of the enterprise to pay its maturing obligations and to meet unexpected needs for cash Profitability Ratios Measures of the income or operating success of an enterprise for a given period of time - Revenues Expenses = Net Income Solvency Ratios Measures of the ability of the enterprise to survive over a long period of time XYZ Co. ILLUSTRATION 15-11 FINANCIAL RATIO CLASSIFICATIONS
CURRENT ASSETS CURRENT RATIO = ——————————— CURRENT LIABILITIES ILLUSTRATION 15-12 CURRENT RATIO The current ratio (working capital ratio) is a widely used measure for evaluating a company’s liquidity and short-term debt-paying ability. It is calculated by dividing current assets by current liabilities and is a more dependable indicator of liquidity than working capital. The current ratios for Quality Department Store and comparative data are shown below. Quality Department Store 2000 1999 $1,020,000 $945,000 = = ————— 2.96:1 ———— 3.1:1 $344,500 $303,000 Industry average Sears, Roebuck and Co. ———————— ——————————— 1.34:1 2.38:1
ILLUSTRATION 15-13 CURRENT ASSETS OF QUALITY DEPARTMENT STORE 2000 1999 Current assets Cash $ 100,000 $ 155,000 20,000 Temporary invest. 70,000 Receivables (net) 180,000 230,000 Inventory 500,000 620,000 Prepaid expenses 50,000 40,000 Total current assets $ 1,020,000 $ 945,000
CASH + MARKETABLE SECURITIES + RECEIVABLES (NET) ACID-TEST RATIO = ———————————————————————————— CURRENT LIABILITIES ILLUSTRATION 15-14 ACID-TEST RATIO The acid-test ratio (quick ratio) is a measure of a company’s short-term liquidity and is calculated by dividing the sum of cash,marketable securities, andnet receivables by current liabilities. The acid-test ratios for Quality Department Store and comparative data are shown below. Quality Department Store 2000 1999 $100,000 + $20,000 + $230,000 $155,000 + $70,000 + $180,000 —————————————— = 1.0:1 —————————————— = 1.3:1 $344,500 $303,000 Industry average Sears, Roebuck and Co. ———————— ——————————— 1.3:1 1.3:1
CURRENT CASH DEBT NET CASH PROVIDED BY OPERATING ACTIVITIES COVERAGE RATIO = ———————————————————————— AVERAGE CURRENT LIABILITIES ILLUSTRATION 15-15 CURRENT CASH DEBT COVERAGE RATIO The current cash debt coverage ratio usually provides a superior representation of liquidity since it uses not cash provided by operating activities rather than a balance at a point in time. Quality Department Store’s current cash debt coverage ratios for 2000 and 1999 are calculated below. Quality Department Store 2000 1999 $404,000 $340,000 - - —————————— 1.25:1 —————————— 1.15:1 [ ] [ ] $303,000 + $344,500 $290,000 + $303,000 —————————— —————————— 2 2 Industry average Sears, Roebuck & Co. ———————— ——————————— 1.1:1 0.137:1
NET CREDIT SALES RECEIVABLES TURNOVER = ——————————————— AVERAGE NET RECEIVABLES ILLUSTRATION 15-16 RECEIVABLES TURNOVER The receivables turnover ratio is used to assess the liquidity of the receivables. It measures the number of times, on average, receivables are collected during the period. The ratio is calculated by dividing net credit sales by average net receivables during the year. The receivables turnover ratio and comparative data for Quality Department Store for 2000 and 1999 are calculated below. Quality Department Store 2000 1999 $2,097,000 $1,837,000 = = —————————— 10.2 times —————————— 9.7 times [ [ ] ] $180,000 + $230,000 $200,000 + $180,000 —————————— —————————— 2 2 Industry average Sears, Roebuck & Co. ———————— ——————————— 15.7 times 2.19 times
COST OF GOODS SOLD INVENTORY TURNOVER = ———————————— AVERAGE INVENTORY ILLUSTRATION 15-17 INVENTORY TURNOVER The inventory turnover ratio measures the number of times, on average, the inventory is sold during the period – which measures the liquidity of the inventory. It is calculated by dividing cost of goods sold by average inventory during the year. The inventory turnover ratio and comparative data for Quality Department Store for 2000 and 1999 are calculated below. Quality Department Store 2000 1999 $1,281,000 $1,140,000 —————————— = 2.3 times —————————— = 2.4 times [ ] [ ] $500,000 + $620,000 $450,000 + $500,000 —————————— —————————— 2 2 Industry average Sears, Roebuck and Co. ———————— ——————————— 6.22 times 4.61 times
NET INCOME PROFIT MARGIN ON SALES = —————— NET SALES ILLUSTRATION 15-18 PROFIT MARGIN RATIO The profit margin ratio is a measure of the percentage of each dollar of sales that results in net income. It is calculated by dividing net income by net sales for the period. The profit margin ratios and comparative data for Quality Department Store for 2000 and 1999 are calculated below. Quality Department Store 2000 1999 $263,800 $208,500 ————— = 12.6% ————— = 11.4% $2,097,000 $1,837,000 Industry average Sears, Roebuck and Co. ———————— ——————————— 3.16% 1.8%
NET CASH PROVIDED BY OPERATING ACTIVITIES CASH RETURN ON SALES RATIO = ————————————————————————— NET SALES ILLUSTRATION 15-19 CASH RETURN ON SALES RATIO The cash basis counterpart of the profit margin ratio is the cash return on sales ratio which uses net cash provided by operating activities as the numerator and net sales as the denominator. Using net cash provided by operating activities of $404,000 in 2000 and $340,000 in 1999, Quality Department Store’s cash return on sales ratios are calculated and evaluated below. Quality Department Store 2000 1999 $404,000 $340,000 ————— = 19.3% ————— = 18.5% $2,097,000 $1,837,000 Industry average Sears, Roebuck and Co. ———————— ——————————— 6.2% 7.4%
NET SALES ASSET TURNOVER = ————————— AVERAGE ASSETS ILLUSTRATION 15-20 ASSET TURNOVER The asset turnover ratio measures how efficiently a company uses its asset to generate sales. It is determined by dividing net sales by average assets for the period. Quality Department Store’s cash return on sales ratios are calculated and evaluated below. Quality Department Store 2000 1999 $2,097,000 $1,837,000 —————————— = 1.2 times ——————————— = 1.21 times [ ] [ ] $1,595,000 + $1,835,000 $1,446,000 + $1,595,000 ——————————— ——————————— 2 2 Industry average Sears, Roebuck & Co. ———————— ——————————— 2.32 times 1.1 times
NET INCOME RETURN ON ASSETS = ————————— AVERAGE ASSETS ILLUSTRATION 15-21 RETURN ON ASSETS An overall measure of profitability is the return on assets ratio. It is calculated by dividing net income by average assets for the period. Quality Department Store’s return on assets ratios for 2000 and 1999 are calculated and evaluated below. Quality Department Store 2000 1999 $263,800 $208,500 [ ] [ ] ——————————— = 15.4% ——————————— = 13.7% $1,595,000 + $1,835,000 $1,446,000 + $1,595,000 ——————————— ——————————— 2 2 Industry average Sears, Roebuck & Co. ———————— ——————————— 1.99% 7.42%
RETURN ON COMMON NET INCOME STOCKHOLDERS’ EQUITY = ——————————————————————— AVERAGE COMMON STOCKHOLDERS’ EQUITY ILLUSTRATION 15-22 RETURN ON COMMON STOCKHOLDERS’ EQUITY A ratio that measures profitability from the viewpoint of the common stockholder is return on common stockholders’ equity. It is calculated by dividing net income by average common stockholders’ equity for the period. Quality Department Store’s return on common stockholders’ equity for 2000 and 1999 are calculated and evaluated below. Quality Department Store 2000 1999 $263,800 $208,500 [ ] [ ] ——————————— = 29.3% ——————————— = 28.5% $795,000 + $1,003,000 $667,000 + $795,000 ——————————— ——————————— 2 2 Industry average Sears, Roebuck and Co. ———————— ——————————— 18.6% 10.9%
RATE OF RETURN ON COMMON NET INCOME – PREFERRED DIVIDENDS STOCKHOLDERS’ EQUITY = ——————————————————————— AVERAGE COMMON STOCKHOLDERS’ EQUITY ILLUSTRATION 15-23 RETURN ON COMMON STOCKHOLDERS’ EQUITY WITH PREFERRED STOCK When preferred stock is present, preferred dividend requirements are deducted from net income to determine income available to common stockholders. The par value of preferred stock (or call price – if applicable) must be deducted from total stockholders’ equity to arrive at the amount of common stockholders’ equity used in this ratio. The ratio then appears as shown below.
EARNINGS NET INCOME PER SHARE = ———————————————————————————— WEIGHTED AVERAGE COMMON SHARES OUTSTANDING ILLUSTRATION 15-24 EARNINGS PER SHARE Earnings per share (EPS) ofcommon stock is a measure of net income earned on each share of common stock. It is calculated by dividing net income by the number of weighted average common shares outstanding during the year. Quality Department Store’s EPS for 2000 and 1999 are calculated and evaluated below. Quality Department Store 2000 1999 $263,000 $208,500 - - [ ] ————————— $.97 ————— $.77 270,000 + 275,400 270,000 ————————— 2
MARKET PRICE PER SHARE OF COMMON STOCK PRICE-EARNINGS RATIO = ————————————————————————— EARNINGS PER SHARE ILLUSTRATION 15-25 PRICE-EARNINGS RATIO The price-earnings (PE) ratio measures the ratio of the market price of each share of common stock to the earnings per share. It is calculated by dividing the market price per share of common stock by earnings per share. Quality Department Store’s PE ratios for 2000 and 1999 are calculated and evaluated below. Quality Department Store 2000 1999 $12.00 $ 8.00 ——— = 12.4 times ——— = 10.4 times $ .97 $ .77 Industry average Sears, Roebuck and Co. ———————— ——————————— 33 times 22 times
CASH DIVIDENDS PAYOUT RATIO = ————————— NET INCOME ILLUSTRATION 15-26 PAYOUT RATIO The payout ratio measures the percentage of earnings distributed in the form of cash dividends. It is calculated by dividing cash dividends by net income. Quality Department Store’s payout ratios for 2000and 1999 are calculated and evaluated below. Quality Department Store 2000 1999 $61,200 $60,000 ————— = 23.2% ————— = 28.8% $263,800 $208,500 Industry average Sears, Roebuck and Co. ———————— ——————————— 17.5% 44.5%
TOTAL DEBT DEBT TO TOTAL ASSETS = ———————— TOTAL ASSETS ILLUSTRATION 15-27 DEBT TO TOTAL ASSETS The debt to total assets ratio measures the percentage of total assets provided by creditors, indicating the degree of leveraging. It is calculated by dividing total debt by total assets. Quality Department Store’s total debt to total assets ratios for 2000 and 1999 are calculated and evaluated below. Quality Department Store 2000 1999 $832,000 $800,000 ————— = 45.3% ————— = 50.2% $1,835,000 $1,595,000 Industry average Sears, Roebuck and Co. ———————— ——————————— 42.0% 81.7%
TIMES INTEREST INCOME BEFORE INCOME TAXES AND INTEREST EXPENSE EARNED = ————————————————————————————— INTEREST EXPENSE ILLUSTRATION 15-28 TIMES INTEREST EARNED The times interest earned ratio provides an indication of the company’s ability to meet interest payments as they come due. It is calculated by dividing income before income taxes and interest expense by interest expense. Quality Department Store’s times interest earned ratios for 2000 and 1999 are calculated and evaluated below. Quality Department Store 2000 1999 $468,000 $388,000 ———— 13 times ———— 9.6 times = = $36,000 $40,500 Industry average Sears, Roebuck and Co. ———————— ——————————— 7.39 times 1.86 times
NET CASH PROVIDED BY OPERATING ACTIVITIES CASH DEBT COVERAGE RATIO = ————————————————————————— AVERAGE TOTAL LIABILITIES ILLUSTRATION 15-29 CASH DEBT COVERAGE RATIO The ratio of net cash provided by operating activities to average total liabilities is the cash debt coverage ratio and is a measure of solvency. Quality Department Store’s cash debt coverage ratios for 2000 and 1999 are calculated and evaluated below. Quality Department Store 2000 1999 $404,000 $340,000 [ ] [ ] —————————— = .495 times —————————— = .442 times $800,000 + $832,000 $740,000 + $800,000 ——————————— ——————————— 2 2 Industry average Sears, Roebuck and Co. ———————— ——————————— .38 times .09 times
ILLUSTRATION 15-30 SUMMARY OF LIQUIDITY, PROFITABILITY, AND SOLVENCY RATIOS
ILLUSTRATION 15-30 SUMMARY OF LIQUIDITY, PROFITABILITY, AND SOLVENCY RATIOS
ILLUSTRATION 15-30 SUMMARY OF LIQUIDITY, PROFITABILITY, AND SOLVENCY RATIOS
ILLUSTRATION 15-30 SUMMARY OF LIQUIDITY, PROFITABILITY, AND SOLVENCY RATIOS
EARNING POWER AND IRREGULAR ITEMS • For users of financial statements to determine earning power or regular income, the irregular items are separately identified on the income statement. • Three types of irregular items are reported: 1Discontinued operations, 2Extraordinary items, and 3Changes in accounting principle.
DISCONTINUED OPERATIONS • Discontinued operations constitutes the disposal of a significant segment of a business. • The income (loss) from discontinued operations consists of 1 the income (loss) from operations and 2the gain (loss) on disposal of the segment.
ILLUSTRATION 15-31 STATEMENT PRESENTATION OF DISCONTINUED OPERATIONS Acro Energy Inc. has revenues of $2.5 million and expenses of $1.7 million from continuing operations in 2002. The company therefore has income before income taxes of $800,000. The company discontinued and sold its unprofitable chemical division during 2002. The 2002 loss from chemical operations was $140,000 (net of $60,000 in income taxes), and the loss on disposal of the chemical division (net of $30,000 in income taxes), was $70,000. Given a 30% income tax rate, the partial income statement presentation is shown below.
EXTRAORDINARY ITEMS • Extraordinary items are events and transactions that meet two conditions: they are 1unusual in nature and 2infrequent in occurrence. • Extraordinary items are reported net of taxes in a separate section of the income statement immediately below discontinued operations.
CONDEMNED ILLUSTRATION 15-32 EXAMPLES OF EXTRAORDINARY AND ORDINARY ITEMS SALE 4.Destruction of property by fire or explosion
ILLUSTRATION 15-33 STATEMENT PRESENTATION OF EXTRAORDINARY ITEMS In 2002 a revolutionary foreign government expropriated property held as an investment by Acro Energy Inc. If the loss is $70,000, before applicable income taxes of $21,000, the partial income statement presentation will show a deduction of $49,000 – as shown below. ACRO ENERGY INC. Partial Income Statement For the Year Ended December 31, 2002 Income before income taxes $800,000 Income tax expense 240,000 Income from continuing operations 560,000 Discontinued operations Loss from operations of chemical division, net of $60,000 income tax saving $ 140,000 Loss from disposal of chemical division, net of $30,000 income tax saving 70,000 210,000 Income before extraordinary item 350,000 Extraordinary item Expropriation of investment, net of $21,000 income tax saving 49,000 Net income $ 301,000
CHANGE IN ACCOUNTING PRINCIPLE • To make them comparable, financial statements are expected to be prepared on a basis consistent with that used in the preceding period. • A change in accounting principle occurs when the principle used in the current year is different from the one used in the preceding year. • A change is permitted when 1management can show that the new principle is preferable to the old principle and 2the effects of the change are clearly disclosed in the income statement.
CHANGE IN ACCOUNTING PRINCIPLE When a change in accounting principle has occurred, 1the new principle should be used in reporting the results of operations of the current year and 2the cumulative effect of the change on all prior year income statements should be disclosed net of applicable income taxes in a special section immediately preceding net income.
ILLUSTRATION 15-34 STATEMENT PRESENTATION OF CUMULATIVE EFFECT OF CHANGE IN ACCOUNTING PRINCIPLE At the beginning of 2002, Acro Energy Inc. changes from the straight-line method of depreciation to the declining-balance method for equipment purchased on January 1, 1999. Assuming a 30% income tax rate the net of income tax effect of the change is $16,800 ($24,000 X 70%). The partial income statement presentation is shown below.
LIMITATIONS OF FINANCIAL ANALYSIS You should be aware of some of the limitations of the three analytical tools illustrated in the chapter and of the financial statements on which they are based. 1Estimates: Financial statements contain numerous estimates; to the extent that these estimates are inaccurate, the financial ratios and percentages are inaccurate. 2Cost: Traditional financial statements are based on cost and are not adjusted for price-level changes. Comparisons of unadjusted financial data from different periods may be rendered invalid by significant inflation or deflation.
LIMITATIONS OF FINANCIAL ANALYSIS 3Alternative Accounting Methods: Variations among companies in the application of GAAP may hamper comparability. Although differences in accounting methods might be detectable from reading the notes to the financial statements, adjusting the financial data to compensate for the different methods is difficult, if not impossible, in some cases. 4Atypical Data: Fiscal year-end data may not be typical of the financial condition during the year. Firms often establish a fiscal year-end that coincides with the low point in operating activity or in inventory levels. Thus, certain account balances may not be representative of the account balances during the year. 5Diversification of Firms: Diversification in American industry also restricts the usefulness of financial analysis. Many firms today are too diversified to be classified by industry, while others appear to be comparable when they are not.
Copyright © 2003 John Wiley & Sons, Inc. All rights reserved. Reproduction or translation of this work beyond that named in Section 117 of the 1976 United States Copyright Act without the express written consent of the copyright owner is unlawful. Request for further information should be addressed to the Permissions Department, John Wiley & Sons, Inc. The purchaser may make back-up copies for his/her own use only and not for distribution or resale. The Publisher assumes no responsibility for errors, omissions, or damages, caused by the use of these programs or from the use of the information contained herein. COPYRIGHT