Download
1 / 17
170 likes | 302 Vues
Annuity Payment Ideas. Annuities refer to a periodic payment plan, or what we might call a uniform series. Here we will consider each payment to be equal. 0 1 2 3 … n. A A A.

E N D
Annuity Payment Ideas Annuities refer to a periodic payment plan, or what we might call a uniform series. Here we will consider each payment to be equal.
0 1 2 3 … n A A A
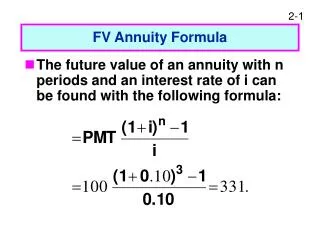
On the previous screen I have an annuity, or uniform series, for three periods. Note that at the end of each of three periods the same payment is made. In general we could talk about n periods. Here we will assume the rate of interest is the same each period. On the next slide I have added the F (future) value at the end of the third period. This graph would be useful in two contexts. When F is unknown and A is known (along with the interest rate, i, and the time frame, n), we have a future value/ annuity relationship. A could be the unknown and we know F. The same graph highlights both ideas, we just need to be aware of which is unknown.
F 0 1 2 3 … n A A A
The future value of the annuity – sometimes called the uniform series compound amount In the context of the example from a few screens back, one question we like answered is how much will be in the account when the last payment is made? With three periods, F would include the A at the end of time 3, plus the A at the end of the second period times (1 + i), plus the A at the end of time period 1 times (1 + i)2. In other words F = A + A(1 + i) + A(1 + i)2. Note that when we have three periods the highest power term is 2. Now, multiply both sides by (1 + i) to get (1 + i)F = A(1 + i) + A(1 + i)2 + A(1 + i)3.
Now, it must be true that (1 + i)F – F = A(1 + i) + A(1 + i)2 + A(1 + i)3 – (A + A(1 + i) + A(1 + i)2). So, iF = A(1 + i)3 – A = A[(1 + i)3 – 1], or F = A [{(1 + i)3 – 1}/i]. Note when we have three periods and do some algebra the highest power is 3. The term in brackets might be called the annuity, or uniform series, compound amount factor. If we had n periods as the context the equation would be changed to have n where the 3 is located. In the formula the term is [] is found on page 682 of our book – table of future value of annuity factors. The table is limited. I show how to do this in Excel below.
On slide 7 you see the column FV. I assumed a 10 percent interest rate each period. If you look at time period 3 you see the value $3.31 (this is the value in the table). This is what you would have in the account at the end of the third period if you put $1 into an account at the end of each of the 1st, 2nd, and 3rd periods. Each row of the FV column represents a time frame. If you only put $1 away for each of two periods you would only have $2.10 in the account at the end of the 2nd period. What would you have after 7 periods if you put $1 down at the end of each of 7 periods? You would have $9.49! Now, in cell B6 I typed =FV($B$2,a6,-1). I typed it this way so that I could then drag the formula down through cell B15. Then =FV tells Excel to get the future value formula.
In general the FV formula is of the form =fv(interest rate per period,time frame, -annuity value). So for the interest rate I put $B$2. In cell B2 I have the value .1 and I put dollar signs with each part of the cell because when I drag down it will always look at that cell. The $ signs anchor that cell in the formula. For the time frame I point to a6, which has a value of 1. But a6 without dollar signs will change to a7, a8 and so on as I drag down the column (which is what want). For the annuity value I put –1. Tables in books usually base the tables on $1 and if we have a problem of more than $1 we just multiply the tabled value by the dollar amount. I put a minus 1 so in the table we get positive amounts.
The annuity value from a future amount – sometimes called a uniform series sinking fund. Here the context is that we want to have a certain amount in the future, so how much do we have to sink into a fund at the end of each period in order to have the F amount. So here we are solving for the A based on an F value. Before we saw F = A [{(1 + i)3 – 1}/i] and the term in [] is found in the table on page 682. When we need to find A we just take the F and divide by the appropriate value in the table on page 682. In short hand we have A = F/tabled value.
The A/F column in the Excel spreadsheet is useful here. What does the $0.16 mean in cell D10, for example? It means if you want $1 at the end of 5 periods you have to put 16 cents down at the end of each of the 5 periods. The function in Excel to get this is =PMT(interest rate,time frame,, -F). So in cell d6 I typed =PMT($B$2, a6,,-1). I have the double comma after a6 because in general the function solves for A if P or F is known and P comes first. In the context of F, leave the P part blank.
This is the general graph from when we want to find a relationship between A and P. P 0 1 2 3 … n A A A
The present value of an annuity – sometimes called the uniform series present value. The context here is to still have an annuity for n periods, but now we might have a context like the following. What amount is needed now so that A can be taken out at the end of each of n periods and have nothing in the account when the last A is taken? I will not do the algebra, although if you want it I can supply it. I did it before to show the process. The basic result is P = A times the appropriate tabled value on the bottom of page 683. The PV column on slide 7 shows how we can get Excel to give us these answers. Remember the time frame is end of periods. What does the $2.49 mean in cell C8?
If I had $2.49 at time 0 and let it earn interest for 1 period at 10 percent I would have 2.49 + 2.49(.1) = 2.74 and then if I took $1 out I would have 1.74 left. Then if this earned 10% for another period it would be 1.91. If I took out $1, .91 would be left. If this earned 10% for a period it would grow to 1.001 and we could take it and the account would be empty. So the $2.49 in the time 3 row under PV means we have to have $2.49 at time 0 in order to have an annuity of $1 for 3 years. In general, in cell C6 I typed =PV(interest rate,time frame, -annuity value). For reasons similar to what I described above I typed in cell C6 =PV($B$2,a6,-1) and then dragged down to cell c15.
The annuity value given a present value – sometimes called the uniform series capital recovery amount Here is the context of the problem. If we have a given amount today, how much can we recover in a constant amount over n periods. A = P/tabled value on bottom page 683. The A/P column in the Excel spreadsheet is useful here. What does the $0.19 mean in row 13 column E of the spreadsheet mean? It means that for every $1 you have at time 0 you can get 19 cents at the end of each of the first 8 periods. In cell e6 I typed =PMT($B$2, a6, -1) and dragged the formula down to cell e15. So here we have covered uniform series – or annuity - formulas.
Examples 1) Put 100 down at the end of each of three years. If interest is 8% what do you have at the end of three years? Using table on page 682, F = 100(3.246) = 324.6 Using excel F =fv(interest rate per period,time frame, -annuity value) = fv(.08, 3, -100) = 324.64 The answers are a tad different because the book rounds to two digits. 2) Say you want 1000 in three years. How much should you put down at the end of each of three years when the interest rate is 8%? Using table on page 682, A = 1000/3.246 = 308.07 Using Excel, A =PMT(interest rate,time frame,, -F) = PMT(.08,3,,-1000) = 308.03
3) Say want $200 a year for each of the next three years. If you can earn 8%, what do you need to have now to generate these amounts? Using the table on page 683, P = 200(2.577) =515.4 Using Excel, P =PV(interest rate,time frame, -annuity value) =PV(.08, 3, -200) = 515.42 4) Say you have 500 now and you can earn 8% over three years. What is the annuity value you can draw out over the three years (and then the 500 is gone)? Using the table on page 683, A = 500/(2.577) = 194.02 Using Excel, A =PMT(interest rate,time frame, -P) =pmt(.08,3,-500) = 194.02