Download
1 / 40
420 likes | 765 Vues
Modeling Geomagnetic Storm Dynamics . by Vania K. Jordanova Space Science Center/EOS Department of Physics University of New Hampshire, Durham, USA. • Origin, growth, and recovery of geomagnetic storms • Theoretical approaches for studying inner magnetosphere dynamics

E N D
Modeling Geomagnetic Storm Dynamics by Vania K. Jordanova Space Science Center/EOS Department of Physics University of New Hampshire, Durham, USA • • Origin, growth, and recovery of geomagnetic storms • • Theoretical approaches for studying inner magnetosphere dynamics • • New insights on geomagnetic storms from kinetic model simulations using multi-satellite data • • Future model developments Tutorial, GEM Workshop, 6/27/03 1
Sources of ring current ions Solar - Interplanetary - Magnetosphere Coupling [Gonzalez et al., 1994] [Chappell et al., 1987] • Solar wind • Ionosphere max H+: solar min & quiet conditions max O+: solar max & active conditions Tutorial, GEM Workshop, 6/27/03 2
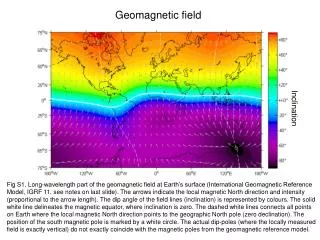
Magnetic Field of the Earth [Hess, 1968] • The main geomagnetic field can be represented by spherical harmonic series in which the first term is the simple dipole term [Gauss, 1839]. Temporal variations of the internal field are modeled by expanding the coefficients in Taylor series in time [e.g., IGRF model, 1995]. • The Earth's real magnetic field is the sum of several contributions including the main (internal) field and the external source (magnetospheric) fields [e.g., Tsyganenko, 1996, 2001]. • Gradient-Curvature velocity: Tutorial, GEM Workshop, 6/27/03 3
Large-Scale Magnetospheric Electric Field • Volland-Stern semiempirical model • convection potential: • corotation potential: • Drift velocity: Cluster/EDI Data IMF Bz<0, 1Re=0.2 mV/m [Matsui et al., 2003] [Lyons and Williams, 1984] Tutorial, GEM Workshop, 6/27/03 4
Cluster/EDI Electric Field Data • • Statistically averaged data at L=4-5, IMF Bz<0, average Kp=2+, corotating frame of reference • • Radial and azimuthal components mapped to equatorial plane • • Strong electric field at MLT=19-22, not observed during northward IMF [Matsui et al., 2003] Tutorial, GEM Workshop, 6/27/03 5
Diffusive Transport • • Standard model [e.g., Sheldon and Hamilton, 1993] • - magnetic diffusion [Falthammer, 1965] • - electric diffusion [Cornwall, 1971] • • The cross-tail potential is enhanced by a superposition of exponentially decaying impulses [Chen et al., 1993; 1994] • • Profiles of normalized ring current energy density indicate the impulsive character of enhancements makes significant contribution in storms with long main phase [Chen et al., 1997] Tutorial, GEM Workshop, 6/27/03 6
Ring Current Loss Processes Energetic Ring Current Belt (1-300 keV) Density Isocontours Neutral Plasmapause Precipitation Lower Density Cold Plasmaspheric Plasma (Dusk Bulge Region) Dawn Ion Cyclotron Charge Waves Exchange Coulomb Conjugate Collisions SAR Arcs Between Ring Currents ( L~4) and Dusk Thermals Anisotropic (Shaded Area) Energetic Ion Precipitation ( L~8 ) ( L~6 ) Wave Scattering of Ring Current Ions Isotropic Energetic Ion [Kozyra & Nagy, 1991] Precipitation Tutorial, GEM Workshop, 6/27/03 7
Theoretical Approaches • • Single particlemotion - describes the motion of a particle under the influence of external electric and magnetic fields • - trajectory tracing studies [e.g., Takahashi & Iyemori, 1989; Ebihara & Ejiri, 2000] • - mapping of distribution function [e.g., Kistler et al., 1989; Chen et al. 1993] • • Magnetohydrodynamics and Multi-Fluid theory - the plasma is treated as conducting fluids with macroscopic variables, allow self-consistent coupling of the magnetosphere and ionosphere • - Rice convection model [e.g., Harel et al., 1981; Wolf et al., 1981; 1997] • • Kinetic theory - adopts a statistical approach and looks at the development of the distribution function for a system of particles [e.g., Fok et al., 1993; Sheldon & Hamilton, 1993; Jordanova et al., 1994] Tutorial, GEM Workshop, 6/27/03 8
Kinetic Model of the Ring Current - Atmosphere Interactions (RAM) • •Initial conditions: POLAR, CLUSTER and EQUATOR-S data • •Boundary conditions: LANL/MPA and SOPA data [Jordanova et al., 1994; 1997] Ro - radial distance in the equatorial plane from 2 to 6.5 RE -azimuthal angle from 0 to 360, E - kinetic energy from 100 eV to 400 keV o- equatorial pitch angle from 0 to 90 - bounce-averaging (between mirror points) Tutorial, GEM Workshop, 6/27/03 9
Model: Drift of Ring Current Particles Initial E=0.2 keV at L=10Initial E=0.4 keV at L=10 The 90 deg pitch angle particle tracings. Asteriks are plotted at 1 hour steps within 20 hours [Ejiri, 1978] Tutorial, GEM Workshop, 6/27/03 10
Model: Ring Current Loss Processes Charge exchange with Hydrogen from geocorona (A) (A+) - cross section for charge exchange with H - bounce-averaged exospheric Hydrogen density [Schulz and Blake, 1990] Loss of particles to the atmosphere due to the emptying of the loss cone (twice per bounce period B) [Lyons, 1973] , where Tutorial, GEM Workshop, 6/27/03 11
Model: Ring Current Loss Processes Coulomb collisions with thermal plasma: - Fokker-Planck equation considering energy degradation & pitch angle scattering - plasmaspheric density model for e-, H+, He+, O+species [Rasmussen et al., 1993] Plasma waves scattering: quasi-linear theory [Kennel and Engelmann, 1966; Lyons and Williams, 1984] - quasi-linear diffusion coefficients including heavy ion components [Jordanova et al., 1996] Tutorial, GEM Workshop, 6/27/03 12
Plasmasphere Model Equatorial plasmaspheric electron density Ion composition: 77% H+, 20% He+, 3% O+ Tutorial, GEM Workshop, 6/27/03 13
EMIC Waves Observations EMIC waves recorded using DE1 magnetometer within 30° MLAT during the 10-year mission lifetime [Erlandson and Ukhorskiy, 2001] • Freja data, April 2-8, 1993 storm, Dst=-170 nT, Kp=8- • •Waveamplitudesdecreased with storm evolution • •Wavesbelow O+ gyrofrequencyobserved near Dst minimum [Braysy et al., 1998] Tutorial, GEM Workshop, 6/27/03 14
Self-consistent Wave-Particle Interactions Model (1) Solve the hot plasma dispersion relation for EMIC waves: where nt, EII, At are calculated with our kinetic model for H+, He+, and O+ ions (2) Integrate the local growth rate along wave paths and obtain the wave gain G(dB) a) Use a semiempirical model to relate G to the wave amplitude Bw: b) Or, use the analytical solution of the wave equation to relate G to the wave amplitude: Bw=Boexp(G), where Bo is a background noise level [Jordanova et al., 2001] Tutorial, GEM Workshop, 6/27/03 15
IMAGE Mission: Imaging the inner magnetosphere • •Simultaneous global images of the plasmasphere and the ring current during the storm main phase (Dst= -133 nT) on May 24, 2000 [Burch et al., 2001] EUV image of the plasmasphere at 0633 UT from above the north pole Superimposed HENA image of 39-60 keV fluxes showing significant ion precipitation near dusk • •The low altitude ENA fluxes peak near dusk and overlap the plasmapause [Burch et al., 2001] Tutorial, GEM Workshop, 6/27/03 16
WIND Data & Geomagnetic Indices:January 9-11, 1997 • •An interplanetary shock arrived at Wind at hour~25 • • It is driven by a magnetic cloud which extends from hour~29 to hour~51 • • Triggered a moderate geomagnetic storm with Dst= -83 nT & Kp=6 Tutorial, GEM Workshop, 6/27/03 17
Convection Electric Field: Comparison with POLAR/EFI Data • Enhanced electric fields are measured below L=5 during the main phase of the storm on the duskside (MLT18) • Such electric fields appear about an hour or more before a strong ring current forms • Much smaller electric fields at larger L shells (L=5-8) and on the dawnside (MLT6) • Good agreement with the MACEP model we developed on the basis of the ionospheric AMIE [Richmond, 1992] model and a penetration electric field [Ridley and Liemohn, 2002] [Boonsiriseth et al., 2001] Tutorial, GEM Workshop, 6/27/03 18
Effects of Inner Magnetospheric Convection: January 10-11, 1997 • Electric potential in the equatorial plane: • • Both models predict strongest fields during the main phase of the storm • •Volland-Stern model is symmetric about dawn/dusk by definition • •MACEPmodel is more complex and exhibits variable east-west symmetry and spatial irregularities Tutorial, GEM Workshop, 6/27/03 19
Ring Current Asymmetry: Main Phase • • Initial ring current injection at high L shells on the duskside • • A very asymmetric ring current distribution during the main phase of the storm due to freshly injected particles on open drift paths • The total energy density peaks near midnight using MACEP, near dusk using Volland-Stern • Ring current ions penetrate to lower L shells and gain larger energy in MACEP than in Volland-Stern Tutorial, GEM Workshop, 6/27/03 20
Ring Current Asymmetry: Recovery Phase • • Energy density peaks near dusk in both MACEP and Volland-Stern models during early recovery phase • The trapped population evolves into a symmetric ring current during late recovery phase Tutorial, GEM Workshop, 6/27/03 21
Model Results: Dst Index, Jan 10, 1997 • Comparison of: • •Kp-dependent Volland-Stern model • • Empirical MACEP model • => MACEP model predicts larger electric field, which results in larger injection rate and stronger ring current buildup Tutorial, GEM Workshop, 6/27/03 22
Modeled Distributions and POLAR Data: Jan 10, 09:30 UT Tutorial, GEM Workshop, 6/27/03 23
Ion Pitch Angle Distributions: POLAR/IPS • • Data are from the southern pass at MLT~6 and E=20 keV on Jan 9 (left), 10 (middle) and 11 (right) • • Empty loss cones, indicating no pitch angle diffusion are observed at these locations Tutorial, GEM Workshop, 6/27/03 24
Ion Pitch Angle Distributions: POLAR/IPS • • Data are from the southern pass at MLT~18 and E=20 keV at hour~8.5 (middle) and at hour~25.5 (right) • • Isotropic pitch angle distributions, indicating strong diffusion scattering are observed at large L shells near Dst minimum • • Partially filled loss cones, indicating moderate diffusion are observed during the recovery phase Tutorial, GEM Workshop, 6/27/03 25
EMIC Waves Excitation:January 10, 1997 • • We calculated the wave growth of EMIC waves from the He+ band (between O+ and He+ gyrofrequency) • • Comparable wave growth is predicted by both models during the early main phase • • Intense waves are excited near Dst minimum and during the recovery phase only whenMACEPmodel is used Tutorial, GEM Workshop, 6/27/03 26
Hour 9 Model Results: Precipitating Proton Flux Hour 25 • • Precipitating H+ fluxes are significantly enhanced by wave-particle interactions • • Their temporal and spatial evolution is in good agreement with POLAR/IPS data at low L shells 27 Tutorial, GEM Workshop, 6/27/03
Effects of Plasma Sheet Variability: March 30 - April 3, 2001 • • An interplanetary (IP) shock is detected by ACE at ~0030 UT on March 31 • • A great geomagnetic storm Dst= -360 nT (SYM-H= -435 nT) and Kp=9- occurs Tutorial, GEM Workshop, 6/27/03 28
LANL Boundary conditions: March - April, 2001 • • Enhanced fluxes are observed in both energy channels of the MPA instrument for ~10 hours after the IP shock • • The magnitude of the ion fluxes gradually decreases after that • • The MPA plasma sheet ion density shows a similar trend Tutorial, GEM Workshop, 6/27/03 29
Effects of Time-Dependent Plasma Sheet Source Population: March 30 - April 3, 2001 • • Enhancement in the convection electric fieldalone is not sufficient to reproduce the Dst index • •The ring current (RC) increases significantly when the stormtime enhancement of plasma sheet density is considered • •The drop of plasma sheet density during early recovery phase is important for the fast RC decay [Jordanova et al., GRL, 2003] 30 Tutorial, GEM Workshop, 6/27/03
EMIC Waves Excitation:July 13-18, 2000 • • Intense EMIC waves from the O+ band are excited near Dst minimum • • The wave gain of the O+ band exceeds the magnitude of the He+ band • • EMIC waves from the O+ band are excited at larger L shells than the He+ band waves [Jordanova et al., Solar Physics, 2001] Tutorial, GEM Workshop, 6/27/03 31
Proton Ring Current Energy Losses • • Proton precipitation losses increase by more than an order of magnitude when WPI are considered • • Losses due to charge exchange are, however, predominant [Jordanova, Space Sci. Rev., 2003] 32 Tutorial, GEM Workshop, 6/27/03
IMAGE/HENA Data, courtesy of Mona Kessel, NASA Tutorial, GEM Workshop, 6/27/03 33
RAM Simulations, movie prepared at NASA, Nov 2000 Tutorial, GEM Workshop, 6/27/03 34
Relativistic Electron Kinetic Model • g - relativistic factor, mo - rest mass, p - relativistic momentum of particle • - radial diffusion coefficients Tutorial, GEM Workshop, 6/27/03 35
Relativistic Electron Transport and Loss • Radial diffusion coefficients [Brautigam and Albert, 2000] • • magnetic field fluctuation • electric field fluctuation • Wave-particle interactions (WPI) • • within plasmasphere [Lyons, Thorne, and Kennel, 1972] • n=±5 cyclotron and Landau resonance • hiss and lightning whistler (10 pT - [Abel and Thorne, 1998; Albert, 1999] • • outside plasmasphere – • E>Eo : empirical scattering rate [Chen and Schulz, 2001] • E<Eo : strong diffusion scattering rate [Schulz, 1974] • Boundary conditions: LANL/MPA and SOPA data Tutorial, GEM Workshop, 6/27/03 36
RAM Electron Results: Test simulations Tutorial, GEM Workshop, 6/27/03 37
Model Results and NOAA Data: October 21-25, 2001 [Miyoshi et al., 2003] Tutorial, GEM Workshop, 6/27/03 38
Conclusions • Thering currentis a very dynamic region that couples the magnetosphere and the ionosphere during geomagnetic storms • New resultsemerging from recent simulation studies were discussed: • • the predominant role of theconvection electric fieldfor ring current dynamics & Dst index • • the importance of the stormtime plasma sheet enhancement and dropoutfor ring current buildup and decay • • the formation of anasymmetricring current during the main and early recovery storm phases • • it was shown that charge exchangeis the dominant internal ring current loss process • • wave-particle interactionscontribute significantly to ion precipitation, however, their effect on the total energy balance of the ring current H+ population is small (~10% reduction) • Future studies • • determine the effect of WPI on the heavy ion components, moreoverO+is the dominant ring current specie during great storms • • study effects of diffusive transport and substorm-induced electric fieldson ring current dynamics • • determine the role of a more realistic magnetic field model • • development of a relativistic electron model Tutorial, GEM Workshop, 6/27/03 39
Acknowledgments • Many thanks are due to: • Yoshizumi Miyoshi, Tohoku University, Japan, & UNH, Durham, USA • R. Thorne, A. Boonsiriseth, Y. Dotan,Department of Atmospheric Sciences, UCLA, CA • M. Thomsen, J. Borovsky, and G. Reeves, Los Alamos Nat Laboratory, NM • J. Fennell and J. Roeder,Aerospace Corporation, Los Angeles, CA • H. Matsui, C. Farrugia, L. Kistler, M. Popecki, C. Mouikis, J. Quinn, R. Torbert, • Space Science Center/EOS, University of New Hampshire, Durham, NH • This research has been supported in part by NASA under grants NAG5-13512, NAG5-12006 and NSF under grant ATM 0101095 Tutorial, GEM Workshop, 6/27/03 40