Download
1 / 29
290 likes | 450 Vues
Using Real Data to Learn Algebra. Concrete Experience Abstract Ideas . Distributive Property Lab. CPO Lever Equipment. Tyner Academy Students. How can we represent this balanced system?. Write a mathematical representation for this.

E N D
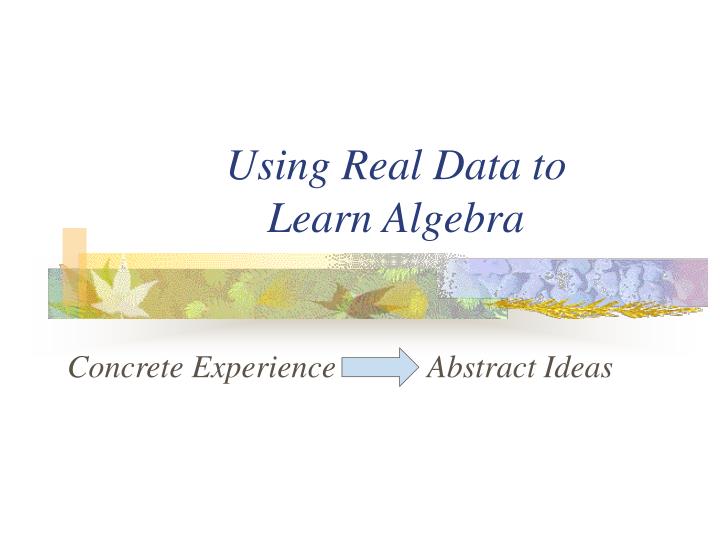
Using Real Data to Learn Algebra Concrete Experience Abstract Ideas
Distributive Property Lab CPO Lever Equipment
What mathematical operation will make the numbers on the left equal the numbers on the right?
Put three marbles in a baggie. Represent the baggie as a parenthesis.
Learning goes through stages. • This is fun!!! • Now what are we supposed to do? • I’m lost • This is stupid!! • We stop and and refocus.
13 = 13 Chappell 10*200 x 13X = 26000x 10*200 2000 = 13X 200 gram mass 13 marbles I see a bag hanging down from a bar. The string is hanging at 18.
Jamel 200 gram mass 13 marbles (200)(10) = (18) + 13 X
Duree 200 gram mass 13 marbles (200)(10) = (18)(13 X) 2000 234
Duree 200 gram mass 13 marbles (200)(10) = (18)(13 X) 2000 234X 234 = 234
Duree 200 gram mass 13 marbles (200)(10) = (18)(13 X) 8.55 = X
Kim 400 grams 200 grams and 6 marbles (400)(19) = (30)(25 + 6x) 7600 = 6000 + 180 X 6000 = 6000 1600 = 180 X
Kim 400 grams 200 grams and 6 marbles 1600 = 180X 180 = 180 8.89 = X
Students learn to: • Set up a data table • Enter the data • Make a scatter plot • Associate the data table with the graph • Draw a best-fit curve • Identify the x,y coordinates
Students learn to: • Calculate slope • Associate meaning with slope • y = mx • force = acceleration * mass • mass = density * volume
Gather DataAsk “How can we represent this?” Plot the Data Write the Mathematical RepresentationTalk About the System Look for opportunities to: