Download
1 / 13
130 likes | 144 Vues
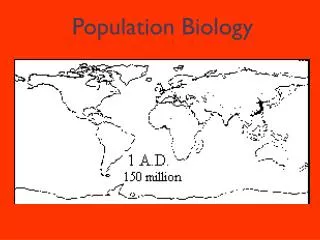
Chapter 4- Population Biology. Why do humans gather in cities? To socialize and obtain resources easily What are the drawbacks to people living in cities? Space. Population growth. Population- number of organisms of the same species living in the same area

E N D
Chapter 4- Population Biology Why do humans gather in cities? To socialize and obtain resources easily What are the drawbacks to people living in cities? Space
Population growth • Population- number of organisms of the same species living in the same area • Dispersal- movement of a population from densely populated locations to new ones • Population growth- change in the size of a population over time • Populations will grow at the same rate if they have enough resources (ex. Food) • Population growth is illustrated by a J-shaped curve (shows that populations will grow at the same rate)
J-shaped curve Also called exponential growth (same rate) Ex. Flies 2 >> 6 >> 18 >> 54 >> 162 >>486 >> 1458 Log phase Lag phase Populations grow slowly at the beginning because reproduction is slow (lag phase) Reproduction increases as the number rises making the population number spike. (exponential phase or log phase)
S-shaped curve • Populations will grow rapidly until they start to run out of resources. Then they will level off called the carrying capacity (illustrated by an S-curve). Also called the stable equilibrium phase Stable equilibrium or carrying capacity Log phase lag phase • Carrying capacity- the number of organisms the resources in an area will support
Birth > deaths = population growth (illustrated in J-curve) Deaths > births = population decline (illustrated in S-curve) There are 2 main factors that restrict population size: Food and space Limiting factors- factors that limits the size of a population Factors affecting population growth:
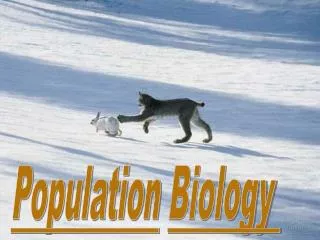
Why do populations not grow at the same rate? • They have different reproductive patterns 2 types of reproductive patterns: • Rapid reproduction(ex. Fly) If an organism lives in a harsh environment, it must reproduce rapidly and have large number to increase chances of survival. Even then, many die • Slow reproduction(ex. Elephant) If the environment is stable and less harsh, then there is not a need for rapid reproduction or a lot of offspring. Parents often take care of these offspring increasing survival. Few die. (ex. Human)
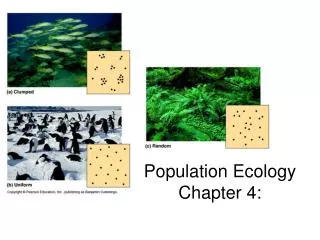
Factors that influence population sizes: Density dependent factors- these factors are dependent on the size (density) of the population examples: food, space, disease Density independent factors- these factors are not dependent on the size of a population examples: droughts, floods, temperature
Population density • Number of individuals per unity area of space (ex. There is a greater population density in New York than in Muscle Shoals)
Population growth terms • Natality- number of individuals added to the population through reproduction over time • Birthrate- number of individuals born per 1000 individuals per year • Mortality- number of deaths in a population over time • Death rate- number of deaths per 1000 individuals per year
Computing population growth • There are 4 components to population growth Population growth = (births + immigration) – (deaths + emigration) Immigration- number of organisms entering an area Emigration- number of organisms exiting an area
Owl pellet lab: Objectives: • To abstract bones of prey from a barn owl pellet • Explain how owl pellets are made and how they are used to study predator/prey interactions • Explain the role of predators in the food web and how their interactions affect the ecosystem
Owl pellet lesson: • Watch the video on the barn owl and answer the questions on the worksheet (15 min.) • Dissect pellet following the procedures and fill in the information on the chart (45 min.) • Clean up and wash hands (10 min) • Answer the analysis questions (rest of class and homework)
Review/discussion: • What role does the owl play in its ecosystem? • What would happen if the rodents were removed? • Knowing the pollutants like DDT are magnified through the food chains, why are higher consumers most threatened. • If organisms live in the same area, they must interact and depend on each other. If an influx of predators occurred in an area, explain some effects it would have in the ecosystem. (3 examples) • Knowing that humans are also predators and that organisms are interdependent, suppose that our population had a massive increase and we completely wiped out the cow population. What are some things that would result from the removal of this prey? Write a letter of at least 100 words to your grandchild (future) describing life 50 years from now without cattle.