Download
1 / 26
260 likes | 405 Vues
Doppler imaging study of starspots using SONG network. Sheng-hong Gu 1 , Andrew Collier Cameron 2 and James Neff 3 1. Yunnan Observatory, China 2. St. Andrews University, UK 3. College of Charleston, USA 2011.9.17 Charleston USA. Outline. Starspots Doppler imaging

E N D
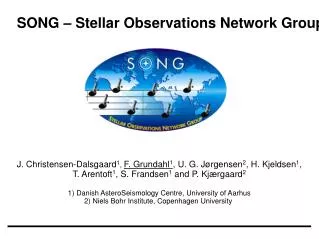
Doppler imaging study of starspots using SONG network Sheng-hong Gu1, Andrew Collier Cameron2 and James Neff3 1. Yunnan Observatory, China 2. St. Andrews University, UK 3. College of Charleston, USA 2011.9.17 CharlestonUSA
Outline • Starspots • Doppler imaging • SONG and its spectrograph • Least-squares deconvolution for faint stars • Purposed programs for SONG network
Starspots • As sunspots • Rotation couples with convectionmagnetic field in the stellar interiorstarspots in the photosphere • Local magnetic field of stellar photosphere, suppress the convection and block the energy from the stellar interior to the surface • dark regions on bright photosphere • Starspots • Can be the probe of internal dynamo activity • Can be use to measure the stellar rotation period, meridional flowand surface differential rotation law which are closely relative to the internal magnetic structure
The most important thing for stellar physics is • The information on the location and migrationpattern of starspots, which is related to the stellar dynamo and internal energy transport,can help us to understandlow-mass stellar evolution and formation
First observing example, irregular eclipsing light curve of AR Lac (Kron 1947) • Up to now, the unique way to derive the starspot pattern (location, morphology)—Doppler imaging technique
Doppler imaging (DI) • Indirect imaging method (Vogt & Penrod 1983, Donati & Collier Cameron 1997, Berdyugina 1998, etc.) • Time series of line profilesSurface map of the star (Animation of Doppler imaging, from Oleg Kochukhov’s website )
DI depends on • Rotational velocity (vsini) of the target • Inclination of rotational axis (i) of the target • Resolution (R) of spectrograph used • S/N of the spectra • Rotational phase coverage in the time-series observations
Some results • The Doppler imaging of young star Speedy Mic (Barnes 2005)
The spot pattern comparison between Sun and EK Dra (Strassmeier 2009) • Sun--G2V, 5Gyr • EK Dra--G1.5V, 100Myr, 10Xrotationsun
Differential rotation of young star AB Dor (Donati & Cameron 1997) • Sun ΔΩ=0.055rad/d • AB Dor ΔΩ=0.0564rad/d
Butterfly diagram of HR 1099 (Berdyugina & Henry 2007) • DI results at two opposite active longitudes • 16 yr cycle • While one active region moves to the pole, the other to the equator (antisymmetry)
SONG and its spectrograph (SONG network, from the website of University of Aarhus)
Song spectrograph (Grundahl 2009) • Advantage • High-resolution R=96000 (1.”3 slit)resolve small spots • High efficiency (>50% at blaze peak from slit to detector) • Large wavelength region (4814A to 6774A)make LSD possible • the iodine cell can be removed “normal” spectroscopic observations • Long time continuous coverageobserve targets with special rotation periods (around 0.5days, 1days, etc.) • Disadvantage • Smaller aperture -- 1mbright stars • Limiting magnitude due to high-resolutionbright stars • Need to use LSD technique to enhance the S/N for fainter stars
Least-squares deconvolution (LSD) for faint stars (Donati et al. 1997) Plenty of photospheric lines in the spectrum obtained by using echelle spectrograph an ”average” profile with high S/N (Cameron 2000)
One order of observed echelle spectrum of V711 Tau and its LSD profile (Gu et al. 2007)
Purposed programs for SONG network • Remove the iodine cell from the light path of SONG spectrograph • Programs • The detection of detailed butterfly diagram of stellar magnetic activity • Differential rotation along the latitude on the surface of star • Meridional flow on stellar surface
The butterfly diagram of solar activity (From NASA website) • In order to get such butterfly diagrams for the active stars, we need a network like SONG to obtain the continuous time-series DIs
Sigma Gem • The best candidate to derive the detailed butterfly diagram for an active star • The known starspot patterns show the migration along the latitude direction • Long period and brightness make it easy to arrange observations • Basic parameters • α,δ07:43:18.7 28:53:01 (2000) • Vmag 4.3 • Sp. type K1 III • log g 2.5 • Teff 4630K • vsini 27.5km/s • Inclination(i) 60degrees • Prot = Porb 19.60days
The first DI results of Sigma Gem (Hatzes 1993) CaI DI FeI DI • 1991-1992 • No polar cap • Active latitude band 55degrees
The second DI results of Sigma Gem (Kovari et al. 2001) • 1996-1997 • Active latitude band 45degrees • 10degrees/5yr migration to the equator
The purposed observing plan • In the beginning and end of observation every night, 4 spectra can be easily obtained during short time (10min.+10min.) for each node of SONG • If we monitor Sigma Gem for 5 years and 6 DI results can be derived every year, finally we will get 30 DI results spanned for about 93 rotation cycles, which will permit us to give the first glimpse for butterfly diagram of this star • The program almost does not affect the running of asteroseismology program!
V711 Tau • A very good candidate for measuring the meridional flow and differential rotation using SONG network • The evidences for meridional flow and differential rotation exist (Strassmeier & Bartus 2000, Petit et al. 2004) • It’s difficult to observe it at a single station due to its period close to 3 days. To get the data with good phase coverage during short time, the only way is using the network like SONG • Basic parameters • α,δ03:36:47.3 00:35:16 (2000) • Vmag 5.9 • Sp. Type G5IV+K1IV • Teff 4800K • log g 3.5 • vsini 41km/s • Inclination(i) 40degrees • Period 2.84days
The observing plan • Four 3-day observing runs with gap of about two weeks every year, dedicate to observe V711 Tau by using all SONG nodes. We will get detailed information on meridional flow and differential rotation by tracing the individual spots based on DI results • It will interrupt the normal observations for asteroseismology four times per year
Other potential targets Name P(days) Vmag Sp. type vsini(km/s) α(2000) δ(2000) • UX Ari 6.44 6.4 G5V/K0IV 6/37 03:26:35.4 28:42:55 • HK Lac 24.43 6.5 F1V/K0III /15 22:04:56.6 47:14:05 • IM Peg 24.65 5.6 K2III-II 24 22:53:02.3 16:50:28 • II Peg 6.72 7.2 K2V-IV 21 23:55:04.0 28:38:01 Observing for anyone of above 4 targets will be at the beginning (one spectrum, 10min.) and end (one spectrum, 10min) of every night for each SONG node, so it almost does not affect the normal asteroseismology observation • EI Eri 1.95 7.0 G5IV 50 04:09:40.7 -07:53:32 • AR Lac 1.98 6.1 G2IV/K0IV 46/81 22:08:40.8 45:44:32 Observing for one of above two stars needs to use 2 nights of the whole SONG network each run, which will interrupt the normal observations for asteroseismology