Download
1 / 11
110 likes | 227 Vues
Phoenix College Carbon Emissions Report. Scope of Project. To determine, track, and potentially reduce : 1. Direct emissions from sources that are owned and/or controlled by your institution (Natural gas, propane, gasoline, diesel fuel, refrigerants, fertilizers).

E N D
Scope of Project • To determine, track, and potentially reduce: 1. Direct emissions from sources that are owned and/or controlled by your institution (Natural gas, propane, gasoline, diesel fuel, refrigerants, fertilizers). 2. Indirect emissions from sources that are neither owned nor operated by your institution but whose products are directly linked to on-campus energy consumption (Purchased electricity). 3. Other emissions attributed to your institution, deemed “optional” emissions by corporate inventories (Employee/student commuting, district financed air travel, landfill waste, paper). *Note: Emission sources that do not pertain to PC’s campus have been excluded.
Total Emissions 2007 - 2009 Total Emissions (Metric Tonnes eCO2)
Emissions per Operating Funds Emissions per operating dollar estimates the environmental impact of PC operation. The upward trend in 2009 is due to an increase in employee/student commuting. These emissions are not considered to be under the control of the institution.
Greenhouse Snapshot Commuting and air travel have been excluded as they are not considered to be under the direct control of the campus. *Values are in MTCDE (Metric Ton Carbon Dioxide Equivalent)
Landfill Waste, Paper, Air Travel & Commuting FY: 2009 - 2010 *Figures above are measured in Metric Tons of Carbon Dioxide Equivalent (MTCDE)
On-Campus Stationary Sources FY: 2010 - 2011 Scope 3: Employee/Student Commuter & Air Travel data have been excluded as they are not considered to be under the control of the institution. *Figures above are measured in Metric Tons of Carbon Dioxide Equivalent (MTCDE)
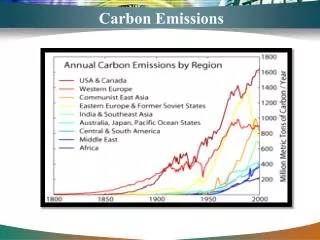
Comparison with other MCCCD Colleges Metric Ton Carbon Dioxide Equivalent (In Millions) Per 1000 Ft. of Building Space *The year for each campus is specified on the next page
Comparison with other MCCCD Colleges PC comes in with lower emissions than six of its sister colleges* * Data for the remaining campuses is/was not available at the time of this report **This column is calculated by calendar year while the others are fiscal year beginning July 1st. *** Metric ton carbon dioxide equivalent **** Full time [student] enrollment [full time + (part time ● 0.5) + (summer ● 0.0)]
Energy Use Analysis Measurements are: One Million British Thermal Units (MMBtu)
Relative Emissions Analysis *Measurements are: Metric tons eCO2 per unit