Download
1 / 42
420 likes | 582 Vues
Heterogeneity. Hermine Maes TC19 March 2006. Files to Copy to your Computer. Faculty/hmaes/tc19/maes/heterogeneity ozbmi.rec ozbmi.dat ozbmiysat(4)(5).mx ozbmiyace(4)(eq)(5).mx Heterogeneity.ppt. Goodness-of-Fit Statistics for BMI in young females.

E N D
Heterogeneity Hermine Maes TC19 March 2006
Files to Copy to your Computer • Faculty/hmaes/tc19/maes/heterogeneity • ozbmi.rec • ozbmi.dat • ozbmiysat(4)(5).mx • ozbmiyace(4)(eq)(5).mx • Heterogeneity.ppt
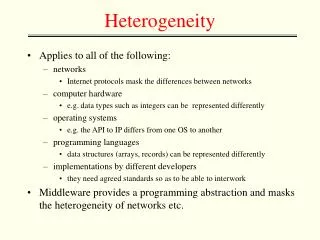
Heterogeneity Questions I • Univariate Analysis: What are the contributions of additive genetic, dominance/shared environmental and unique environmental factors to the variance? • Heterogeneity Analysis: Are the contributions of genetic and environmental factors equal for different groups, such as sex, race, ethnicity, SES, environmental exposure, etc.?
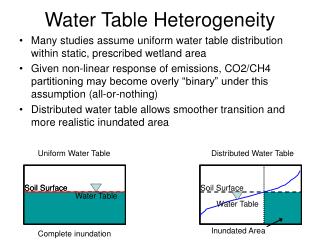
Heterogeneity Questions II • Are these differences due to differences in the magnitude of the effects (quantitative)? • e.g. Is the contribution of genetic/environmental factors greater/smaller in males than in females? • Are the differences due to differences in the nature of the effects (qualitative)? • e.g. Are there different genetic/environmental factors influencing the trait in males and females?
Heterogeneity Females Males
#NGroups 8 G1: female parameters af, ef, df G2: MZF data m1, m2 G3: DZF data m3, m4 G4: female standardized estimates G5: male parameters am, em, dm G6: MZM data m5, m6 G7: DZM data m7, m8 G8: male standardized estimates Heterogeneity Script Move Start Statements to Last Group
Models for Concordant Pairs EP: estimated parameters df=6
Exercise I • Run Saturated Model • ozbmiysat4.mx • Run Heterogeneity Model • ozbmiyade4.mx
Exercise II • Run Homogeneity model • Equate af=am • Equate ef=em • Equate df=dm
#NGroups 6 G1: parameters a, e, d G2: MZF data m1, m2 G3: DZF data m3, m4 G4: MZM data m5, m6 G5: DZM data m7, m8 G6: standardized estimates Homogeneity Script ozbmiyade4eq.mx
Models for Concordant Pairs EP: estimated parameters df=9 df=3
What about DZO? • Var F, Cov MZF, Cov DZF • af, df, ef • Var M, Cov MZM, Cov DZM • am, dm, em • Var Fdzo = Var F, Var M dzo = Var M • Cov DZO • rg
Exercise III • Extend Saturated model to 5 groups • from ozbmiysat4.mx
Goodness-of-Fit Statistics forBMI in young females+males+DZO
Goodness-of-Fit Statistics forBMI in young females+males+DZO
Summary of Models • General Sex Limitation Model: • quantitative and qualitative differences • Heterogeneity Model: • quantitative but no qualitative differences • Homogeneity Model: • no quantitative, no qualitative differences
! Estimate variance components - ACED model! OZ BMI data - young females & males + opp sex • #NGroups 7 • #define nvar 1 • #define nvar2 2 • G1: Parameters • Calculation • Begin Matrices; • X Lower nvar nvar Free ! FEMALES a • Y Lower nvar nvar ! FEMALES c • Z Lower nvar nvar Free ! FEMALES e • W Lower nvar nvar Free ! FEMALES d • S Lower nvar nvar Free ! MALES a • T Lower nvar nvar ! MALES c • U Lower nvar nvar Free ! MALES e • V Lower nvar nvar Free ! MALES d • H Full 1 1 ! scalar, 0.5 • Q Full 1 1 ! scalar, 0.25 • F Full 1 1 Free ! free for DZO • End Matrices;
Group 1 continued • Matrix H .5 • Matrix Q .25 • Start 1 F 1 1 1 • Bound 0 1 F 1 1 1 • Begin Algebra; • A= X*X'; ! FEMALES a^2 • C= Y*Y'; ! FEMALES c^2 • E= Z*Z'; ! FEMALES e^2 • D= W*W'; ! FEMALES d^2 • K= S*S'; ! MALES a^2 • L= T*T'; ! MALES c^2 • N= U*U'; ! MALES e^2 • O= V*V'; ! MALES d^2 • End Algebra; • End
Title G2: MZf data #include ozbmi2.dat Select if zyg =1 Select if agecat =1 Select bmi1 bmi2 ; Begin Matrices = Group 1; M Full 1 nvar2 Free End Matrices; Means M; Covariance A+C+E+D | A+C+D _ A+C+D | A+C+E+D; Option RSiduals; End Title G3: DZf data #include ozbmi2.dat Select if zyg =3 Select if agecat =1 Select bmi1 bmi2 ; Begin Matrices = Group 1; M Full 1 nvar2 Free End Matrices; Means M; Covariance A+C+E+D | H@A+C+Q@D _ H@A+C+Q@D | A+C+E+D; Option RSiduals End Groups 2 & 3
Title G4: MZm data #include ozbmi2.dat Select if zyg =2 Select if agecat =1 Select bmi1 bmi2 ; Begin Matrices = Group 1; M Full 1 nvar2 Free End Matrices; Means M; Covariance K+L+N+O | K+L+O _ K+L+O | K+L+N+O ; Option RSiduals; End Title G5: DZm data #include ozbmi2.dat Select if zyg =4 Select if agecat =1 Select bmi1 bmi2 ; Begin Matrices = Group 1; M Full 1 nvar2 Free End Matrices; Means M; Covariance K+L+N+O | H@K+L+Q@O _ H@K+L+Q@O | K+L+N+O ; Option RSiduals End Groups 4 & 5
Group 6: DZO • Title G6: DZfm data • #include ozbmi2.dat • Select if zyg =5 • Select if agecat =1 • Select bmi1 bmi2 ; • Begin Matrices = Group 1; • M Full 1 nvar2 Free • End Matrices; • Means M; • Covariance • A+C+E+D | F@H@(X*S')+(Y*T')+F@Q@(W*V') _ • F@H@(S*X')+(T*Y')+F@Q@(V*W') | K+L+N+O ; • Option RSiduals • End Variance females Variance males
Group 7 • Title G7: Standardization • Calculation • Begin Matrices = Group 1; • Start .5 all • Start 20 M 2 1 1 - M 2 1 nvar2 • Start 20 M 3 1 1 - M 3 1 nvar2 • Start 20 M 4 1 1 - M 4 1 nvar2 • Start 20 M 5 1 1 - M 5 1 nvar2 • Start 20 M 6 1 1 - M 6 1 nvar2 • Begin Algebra; • G= A+C+E+D; ! FEMALES total variance • J= K+L+N+O; ! MALES total variance • P= A%G| C%G| E%G| D%G_ ! FEMALES stand variance components • K%J| L%J| N%J| O%J; ! MALES stand variance components • End Algebra; • Option NDecimals=4 • !ADE model • Option Sat=8310.308, 3633 • Option Multiple • End
Submodels • Last Group • Option Sat=8310.308, 3633 • Option Multiple • End • Option Issat • End • ! Test for qualitative sex differences (nature of effect) • Drop @1 F 1 1 1 ! drop rg • End • Option Issat • End • ! Test for quantitative sex differences (magnitude of effect) • Equate X 1 1 1 S 1 1 1 ! a_f = a_m • Equate Z 1 1 1 U 1 1 1 ! e_f = e_m • Equate W 1 1 1 V 1 1 1 ! d_f = d_m • End
Exercise IV • Run Sex Limitation Model on 5 groups • ozbmiyade5.mx
Goodness-of-Fit Statistics forBMI in young females+males+DZO