Download
1 / 22
220 likes | 317 Vues
Presentation Outline. The Future of Institutional Research (IR) & Technology in improving first-year students’ success. Example 1: Demonstration of an IR innovation. Example 2: Demonstration of a Technology innovation . The Future of IR and Technology.

E N D
Presentation Outline • The Future of Institutional Research (IR) & Technology in improving first-year students’ success. • Example 1: Demonstration of an IR innovation. • Example 2: Demonstration of a Technology innovation.
The Future of IR and Technology • IR’s future is moving beyond reporting to analysis. This means converting data into ‘actionable’ information that FYE personnel can use. • Technology’s future is moving beyond data management to production of tools that directly facilitate and improve student success.
Example 1:Student-at-Risk Prediction Model • Also known as a predictive model, or enrollment forecasting model. • Helps answer questions like: • Which student variables are most useful for predicting freshmen retention? • What is the “best” combination of variables to optimize predictions? • How useful is this combination for identifying at-risk students?
Relevant Previous Research Astin, A. W. (1993). What matters in college? Four critical years revisited. San Francisco: Jossey-Bass. Bean, J. P. (1985). Interaction effects based on class level in an explanatory model of college student dropout syndrome. American Educational Research Journal,22(1), 35–64. Caison, A. L. (2006). Analysis of institutionally specific retention research: A comparison between survey and institutional database methods. Research in Higher Education,48(4), 435-451. Herzog, S. (2006). Estimating student retention and degree-completion time. Decision trees and neural networks vis-à-vis regression. New Directions for Institutional Research,131, 17-33. Pascarella, E., and Terenzini, P. (2005). How College Affects Student: Volume 2, A Third Decade of Research.San Francisco: Jossey-Bass. Sujitparapitaya, S. (2006). Considering student mobility in retention outcomes. New Directions for Institutional Research,131, 35-51. Tinto, V. (1975). Dropout from higher education: A theoretical synthesis of recent research. Review of Educational Research, 45(1), 89-125.
4 Steps to Modeling Retention 1. Get Freshmen Data. (i.e. We used fall 2009 & 2010 data to build our “training” data set.) 3. Apply model parameters to new data. (i.e. model validation, scoring) 2. Build Model. RETENTION 4. Check the actual 2011retention outcomes to see how well the model performed.
Examples of Student Variables Analyzed On Campus Employment Housing Student Life Activities Athletics STAR Usage Average Class Size Gender Age Ethnicity Residency Geographic Origin CAMPUS EXPERIENCE DEMOGRAPHICS Need Based Aid Non-need Based Aid Pell Grant Work Study % of Aid Met High School GPA & Rank SAT AP CLEP Educational Goals Transfer GPA # Transfer Credits FINANCIAL NEED PRE-COLLEGE PERSISTENCE Credits earned Credits attempted Credit Completion Ratio Math/English Enrollment/Completion Continuous Enrollment Milestone metrics Major Credit Load Credits Earned First Term GPA Distance Education Dual Enrollment High Failure Rate Courses Courses Taken (including Math & English) MILE-STONES ACADEMIC Ethnicity by Geographic Origin Employment by Housing High School GPA by First Term GPA Residency by Need Based Aid Ratio of Successful Adds to Drops INTERACTIONS
7 Strongest Predictors of Retention Strongest These variables account for approximately 39% of the variance in a student’s likelihood of returning for a third semester (Pseudo R Square = .387). 262.804 (.000)* 101.368 (.000)* 20.292 (.000)* 13.486 (.000)* RETENTION IN YEAR 1 7.817 (.005)* 7.134 (.008)* 4.419 (.036)* 3.791 (.052)* *Wald statistic (sig.) The Wald test statistic was used to indicate strength of the variable instead of the coefficient, standardized beta. Because of the nature of the logistic regression, the coefficient is not easily interpretable to indicate strength. Weakest
Predictors in Regression Equation Pseudo Rsquare = .387
Scoring Students • Scoring of relative dropout/retention risk p = exp(a+b1x1+b2x2+b3x3+b4x4….) 1 + exp(a+b1x1+b2x2+b3x3+b4x4….) Where: p = probability of enrollment/non-enrollment exp = base of natural logarithms (~ 2.72) a = constant/intercept of the equation b = coefficient of predictors (parameter estimates)
Example: John is at risk of dropping • John: • is from the continental U.S. (0) • has a below average high school GPA (2.65) • is enrolled in 9 credits (9) • has a low % of financial need met (.45) • isn’t not working on campus (0) • isn’t enrolled in CAS 110 (0) • didn’t specify any educational goals in survey (0) • Probability of Dropping: 0.77
Impact on Campus • 407 freshmen from 2011 dropped out in year one. • Retaining just 22students from 2011 would have improved Mānoa’s overall retention rate from 78.8% to 80%. • Additional Revenue from Tuition and Fees =$210,000 (for 16 HI, 6 WUE, excludes out-of-state!). • Are there 22 students in this group that we can help/retain?
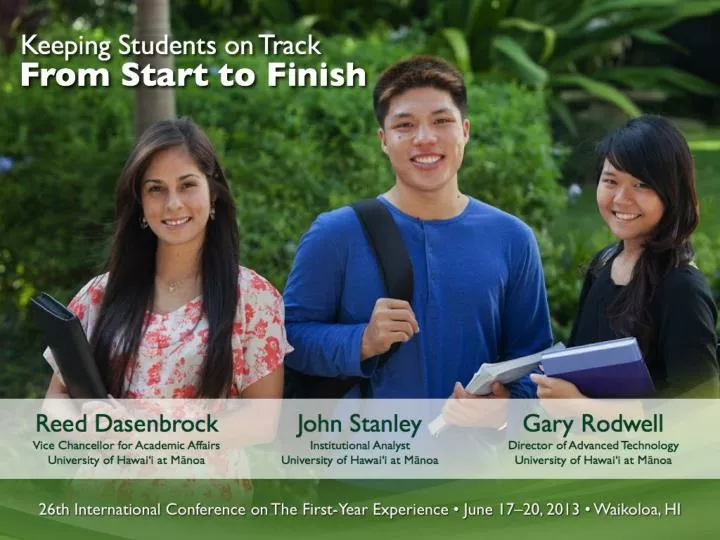
Example 2: ‘STAR’ Technology Gary Rodwell Director of Advanced Technology & Lead Architect of ‘STAR’ University of Hawaii at Manoa
Mahalo Reed Dasenbrock Vice Chancellor for Academic Affairs John Stanley Institutional Analyst Gary Rodwell Director of Advanced Technology University of Hawaii at Manoa Questions: miro@hawaii.edu