Download

1 / 22
220 likes | 574 Vues
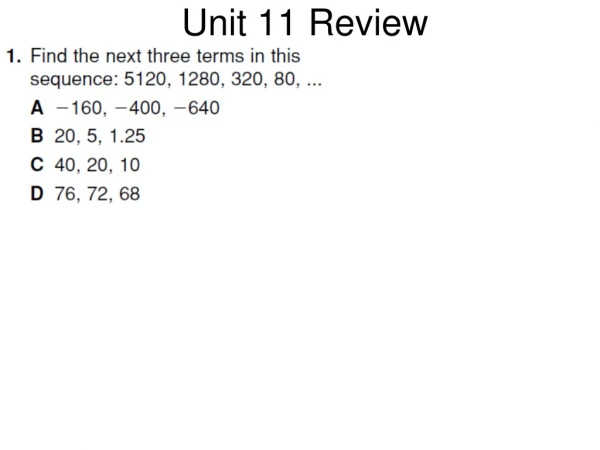
Unit 11 Review . Unit 11 Lesson 8. Looking Back! . Which equation could have been used to create this graph? . y = x + 12 B. y = x + 9 C. y = x – 4. A B C . A B C . Which ordered pair is graphed?. (+5, +6) (+6,ˉ5) (ˉ5,ˉ6) (ˉ5,+6).

E N D
Unit 11 Review Unit 11 Lesson 8
Which equation could have been used to create this graph? • y = x + 12 B. y = x + 9 C. y = x – 4
Which ordered pair is graphed? • (+5, +6) • (+6,ˉ5) • (ˉ5,ˉ6) • (ˉ5,+6)
This map shows the location of the different plants in the garden. What is the location of the fruit trees? • (5, 5) • (9, 5) • (5, 9) • (5, 0)
Manny's graph shows that the total snowfall after two hours was 3 inches. How much snow had fallen after 6 hours? • 4 inches • 6 inches • 9 inches • 10 inches
Manny's graph shows that the total snowfall after 2 hours was 3 in. How long did it take for 11 inches of snow to fall? • 5 hours • 7 hours • 9 hours • 11 hours
Penny's graph shows that her miniature golf score after 6 holes was 19. After how many holes was Penny's score 25? • 7 • 8 • 9 • 10
Manny's graph shows that the total snowfall after 2 hours was 3 in. How much snow fell from the 6th to the 8th hour? • 1 inches • 2 inches • 3 inches • 4 inches
Which equation could have been used to create this function table? • y = 5x • y = x + 9 • y = x + 5 • y = 3x
Which equation could have been used to create this function table? • y = x + 1 • y = 2x • y = x • y = x + 10
Josiah created a function table using the equation b = a + 3. Which table is correct? A B C D
Sarah created a function table using the equation g = 2h. Which table is correct? A B C D
Which best shows the graph of the equation y = x + 10? A B C
Which equation could have been used to create this graph? • y = x + 2 • y = x + 4 • y = 4x • y = x + 0
Harry is renting a cart for the day. He has to pay $1 per hour plus a flat fee of $8 to rent the cart. Which graph shows the total amount Harry will pay if he rents the cart for x hours? a b c
Each shirt in the store has 6 buttons. Which graph shows the number of buttons on r shirts? A B C
Taz mowed 50 lawns last month. He plans to mow more lawns this month. Which equation shows how many lawns Taz will mow in two months? (Use q to represent the total number of lawns Taz will mow, and p to represent the total number of lawns Taz mows this month.) • 50 + p = q • 50/p = q • 50 – p = q • 50p = q
Phillipa earns $10 for each haircut she gives. Which equation shows the amount Phillipa will earn if she gives h haircuts? (Use t to represent the total earned, and h to represent the number of haircuts.) • t = 10 + h • t = 10h • t = 10 – h • t = 10/ h