Download
1 / 17
170 likes | 315 Vues
P-T Slope. Constant Velocity. Consider a car moving with a constant, rightward (+) velocity - say of +10 m/s. Graph of Constant Velocity. If the position-time data for such a car were graphed, then the resulting graph would look like the graph at the right.

E N D
Constant Velocity Consider a car moving with a constant, rightward (+) velocity - say of +10 m/s. Position-Time Graphs
Graph of Constant Velocity If the position-time data for such a car were graphed, then the resulting graph would look like the graph at the right. Position-Time Graphs
Motion described as a constant, positive velocity results in a line of constant and positive slope when plotted as a position-time graph. Constant Velocity Position-Time Graphs
The Meaning of Slope of p-t Graphs The slope of a position vs. time graph reveals pertinent information about an object's velocity. For example: a small slope = small velocity a negative slope = negative velocity a constant slope (straight line) = constant velocity a changing slope (curved line) = changing velocity (more on this later). Position-Time Graphs
Slope of a p-t Graph The actual slope value of any straight line on a graph is the velocity of the object. Slope = Velocity Position-Time Graphs
Example 1 Consider a car moving with a constant velocity of +10 m/s for 5 seconds. The diagram below depicts such a motion. Position-Time Graphs
Graph-Example 1 The position-time graph would look like the graph at the right. Note that during the first 5 seconds, the line on the graph slopes up 10 m for every 1 second along the horizontal (time) axis. Position-Time Graphs
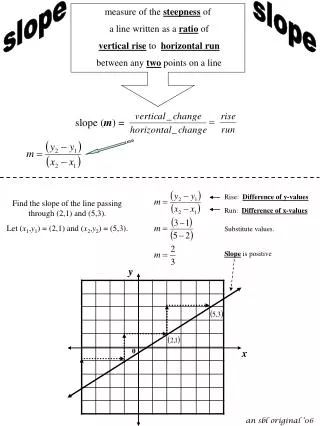
CalculatingSlope Pick two points on the line and determine their coordinates. Determine the difference in y-coordinates of these two points (rise). Determine the difference in x-coordinates for these two points (run). Divide the difference in y-coordinates by the difference in x-coordinates (rise/run or slope). Position-Time Graphs
Calculate the slope y2 – y1 = df – di = rise x2 – x1 tf – ti run 50-0m = 50m = 10 m 5-0 s 5s s Graph-Example 1 Position-Time Graphs
Example2 Now consider a car moving at a constant velocity of +5 m/s for 5 seconds, abruptly stopping, and then remaining at rest (v = 0 m/s) for 5 seconds. Position-Time Graphs
Graph-Example 2 slope = df – di tf – ti 25-0m = 25m = +5 m 5-0 s 5s s slope = df – di tf – ti 25-25m = 0m = 0 m 10-5 s 5s s Position-Time Graphs
Note A slope of zero means that the object is at rest (not moving). Position-Time Graphs
SlopePrinciple The principle is: the slope of the line on a position-time graph is equal to the velocity of the object. If the object is moving with a velocity of +4 m/s, then the slope of the line will be +4 m/s. Position-Time Graphs
3Trials Position-Time Graphs
Interpretation of p-t Graphs Recall: On a p-t graph a negative slope means that the object is moving in the negative direction. A positive slope means that the object is moving in the positive direction. No slope (zero) means that the object is at rest. Position-Time Graphs
Interpretation of p-t Graphs Calculate slope for the following timeframes: 0s – 10s 10s – 15s 15s – 40s 40s – 55s Position-Time Graphs