Download
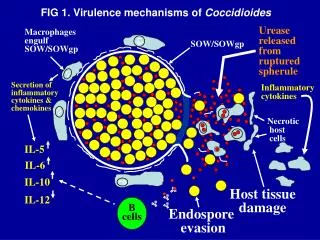
1 / 11
140 likes | 320 Vues
+80 mV. -60 mV. B. J774. G8 cells. A. Non activated macrophages. 2 mM LaCl3. 5 pA. 200 ms. Activated Peritoneal Macrophages. 10 µM CBX. 100 µM LaCl3. 1 mM Prob. 10 µM CBX. 1 mM Prob. 1 µM Mefl. 1 µM Mef. 300 pA. 100 pA. 200 ms. 200 ms. C. D. E.

E N D
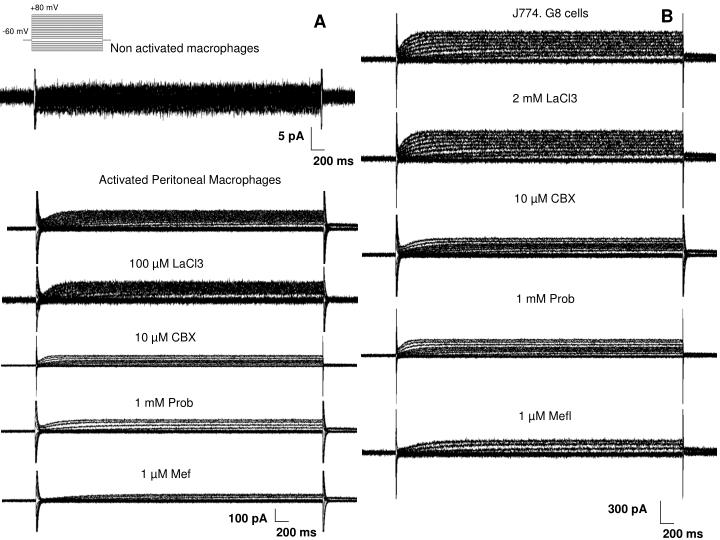
+80 mV -60 mV B J774. G8 cells A Non activated macrophages 2 mM LaCl3 5 pA 200 ms Activated Peritoneal Macrophages 10 µM CBX 100 µM LaCl3 1 mM Prob 10 µM CBX 1 mM Prob 1 µM Mefl 1 µM Mef 300 pA 100 pA 200 ms 200 ms
C D E
Supplementary Fig. 1 Functional mouse Pannexin- 1 ionic currents in non- activated peritoneal macrophages, LPS activated peritoneal macrophages and J774 cells. A: Ionic currents in response to voltage steps from -120 to 80 mV recorded from LPS activated peritoneal macrophages. Prob (1 mM), CBX (10 M) and Mef (1 M) block the outward current. B: Ionic currents in response to voltage steps from -120 to 80 mV recorded from J774 cells. Prob (1 mM), CBX (10 M) and Mef (1 M) block the outward current. In non-activated peritoneal macrophages, we observed only tiny ionic currents. C- E: I-V relationship of LPS activated peritoneal macrophages, J774 cells or non-activated peritoneal macrophages, respectively. In C and D, the J774 cells and LPS activated macrophages were treated or not with 2 mM LaCl3, 10 M CBX, 1 mM Prob, 100 M FFA or 1 M Mef. In E, we plotted the I-V relationship of non activated macrophages. The values represent the means SD of 2-4 experiments performed on different days in the case of the LPS activated peritoneal macrophages and J774 cells. Non-activated peritoneal macrophages values represent the means SD of 25 records performed on five days.
Activated Peritoneal Macrophages 100 µM LaCl3 B A 1 mM Prob Control Control Washout Washout LaCl3 Prob 10 µM CBX 1 µM Mef C D Control Control Washout Washout CBX Mef
Supplementary Fig. 2. Functional mouse Pannexin- 1 ionic currents in LPS activated peritoneal macrophages. Representative traces of 2 s voltage ramps from the holding potential of -120 mV to +80 mV applied in activated peritoneal macrophages before, during and after drug administration in whole-cell patchclamp configuration. In A: 100 μM LaCl3, B: 1 mM Prob, C: 10 μM CBX or D: 1 μM Mef.
J774. G8 cells 100 µM LaCl3 1 mM Prob A B v Control Control Washout Washout LaCl3 Prob 10 µM CBX 1 µM Mef C D Control v Control Washout Washout CBX Mef
Supplementary Fig. 3. Functional mouse Panx1 ionic currents in J774 cells. Representative traces of 2 s voltage ramps from the holding potential of -120 mV to +80 mV applied in J774 cells before, during and after drug administration in whole-cell patch-clamp configuration. In A: 100 μM LaCl3, B: 1 mM Prob, C: 10 μM CBX or D: 1 μM Mef.
Supplementary Fig. 4. Functional mouse Panx1 ionic currents in non-activated peritoneal macrophages. Representative traces of 2 s voltage ramps from the holding potential of -120 mV to +80 mV applied in non-activated peritoneal macrophages before and after to wash the solution in whole-cell patch-clamp configuration.
CTL Acetate 5 mM ATP Acetate + 5 mM ATP
Supplementary Fig. 5. Dye uptake assay with hemichannels blockage by low intracellular pH induced by acetate. A: Dye uptake assay in activated peritoneal mouse macrophages treated or not with acetate 10 mM for inhibition of hemichannels. Left panels are contrast phase, and right panels are EB uptake. B: Quantification of fluorescence within a square (mean of 100 cells per square) treated 10 mM for inhibition of hemichannels . ANOVA analyses were performed on the raw data. *p˂0.05, **p˂0.01, and ***p˂0.001 compared to the ATP group. Experiments were performed in triplicate, and the quantification repeated at least in three days.