Download
1 / 27
270 likes | 393 Vues
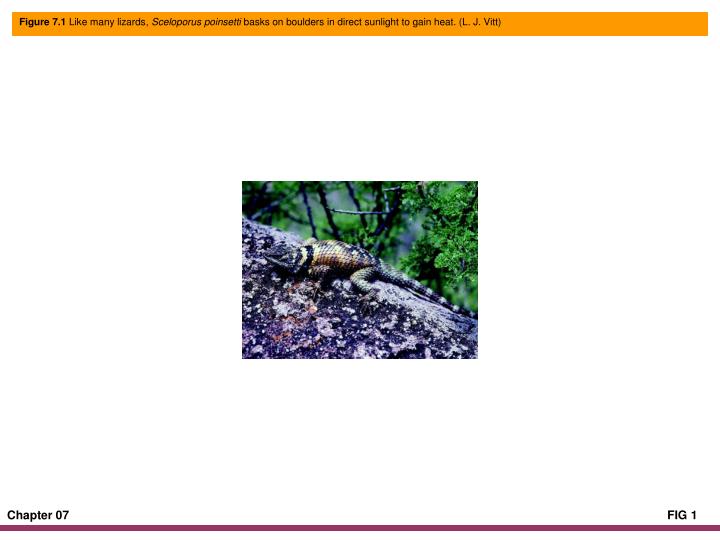
Figure 7.1 Like many lizards, Sceloporus poinsetti basks on boulders in direct sunlight to gain heat. (L. J. Vitt).

E N D
Figure 7.1 Like many lizards, Sceloporus poinsetti basks on boulders in direct sunlight to gain heat. (L. J. Vitt)
Figure 7.2 Lizards and frogs occurring at high elevations in Peru maintain different body temperatures and behave differently in response to temperature at the same locality. The lizard Liolaemus multiformis maintains a relatively high and constant body temperature throughout the day by basking. The toad Rhinella spinulosa reaches about 23°C in the morning by basking in sun and then retreats under a boulder at about 1050 hr. By repeated emergences and retreats, the toad maintains body temperatures below surface soil temperatures. Adapted from Pearson and Bradford, 1976.
Figure 7.3 Profile of body temperature characteristics of an ectotherm. Mean body temperature is based on field data taken on active animals. Set temperature is based on temperatures selected by individuals with external influences eliminated. See Table 7.1 for definitions.
Figure 7.4 The environments in which individual amphibians and reptiles live provide different opportunities for heat exchange based on the medium and the physical structure of the habitat. A reptile differs from the amphibians shown because water loss is much lower and influences body temperature much less. The reptile also is limited in its ability to absorb water directly from the environment. Adapted from Brattstrom, 1979.
Figure 7.5 Theoretically, physiological and behavioral performances are maximized across a relatively narrow range of body temperatures in ectothermic vertebrates (left). Empirical data on Ameiva festiva demonstrate that performance is constrained by temperature. Adapted from Huey and Stevenson, 1979, and Van Berkum et al., 1986.
Figure 7.6 A multitude of factors influence heat exchange and thus body temperatures and thermal ecology of amphibians and reptiles. The effects of some variables are direct, such as orientation and exposure during basking. Others are indirect. Predators, for example, can interfere with an amphibian or reptile's ability to use basking sites, thereby forcing it to maintain activity at suboptimal temperatures. Adapted from Hutchison and Dupré, 1992.
Figure 7.7 Green frogs, Lithobates clamitans, jump varying distances depending upon their body temperature but do most poorly at low and high temperatures. "a" and "b" refer to different sets of samples at 20°C. Adapted from Huey and Stevenson, 1979.
Figure 7.8 Body temperatures determine escape behaviors of active Agama savignyi. At high body temperatures, lizards rely on running (flight) for escape, reflecting the optimization of running speeds at high body temperatures. At lower body temperatures, alternative escape behaviors become more frequent. Defense occurs at three levels: level 1, gape and lunge; level 2, upright stance, body inflated, and tongue protruding; and level 3, all of the preceding plus attack, lashing with tail, and leaping off substrate to bite. Adapted from Hertz et al., 1982.
Figure 7.9 Morphology, physiology, and behavior have evolved together among 13 species of lacertid lizards. Relative hindlimb length (residual hindlimb length) is correlated with absolute maximal running speed, which correlates with relative sprint speed. Attributes of thermal physiology are also correlated. Heavy lines indicate significantly correlated traits and, because the analysis is based on phylogenetically independent contrasts, the effects of phylogenetic relatedness have been accounted for. Adapted from Bauwens et al., 1995.
Figure 7.10 Hatchling sex and incubation treatment (falling, rising, or stable temperatures during development) influence incubation periods and phenotypic traits of hatchling Bassiana duperreyi. Some traits (tail length, speed, and mass) were correlated with size (snout–vent length), so values shown are adjusted for the effect of size. Open bars, males; Shaded bars, females. Adapted from Shine, 2004.
Figure 7.11 Many lizards regulate their body temperatures within a relatively narrow range by behavioral adjustments. During morning, when rock surfaces are relatively cool, Tropidurus hispidus basks in sun to gain heat. As rock temperatures increase during the day, the lizards spend more time on shaded rock surfaces or in crevices using cool portions of their habitat as heat sinks. Late in the day, when exposed rock surfaces cool, lizards shift most activity to open rock surfaces that remain warm and allow the lizards to maintain high body temperatures longer. Adapted from Vitt et al., 1996.
Figure 7.12 Precision of thermoregulation in Anolis lizards. The upper panels show body temperatures of lizards; the lower panel shows operative environmental temperatures; and the shaded bars show set or preferred temperatures of the lizards. Arrows indicate means. Similarity of body temperatures to set temperatures indicates accuracy of thermoregulation. The accuracy of thermoregulation varies with season in Anolis cristatellus as the result of shifts in environmental temperatures. The accuracy of thermoregulation is high in A. gundlachi, even though it does not thermoregulate. In this case, the environmental temperatures are nearly identical to set temperatures of the lizards. Adapted from Hertz et al., 1993.
Figure 7.13 Thermal ecology of the herbivorous teiid lizard Cnemidophorus murinus on Bonaire. The lizards maintain body temperatures (Tb) during most of the day that exceed their preferred body temperatures (Tsel). Although environmental temperatures (Te) vary considerably, they are highest from 1100–1600 hr (not shown), providing limited microhabitats with low temperatures. Adapted from Vitt et al., 2005.
Figure 7.14 Temperatures during a typical wet-season day in northern Australia for the two monitor lizards, V. gouldii (left) and V. panoptes (right). Temperatures included are the following: telemetry-measured body temperatures (Tb), mean-predicted body temperatures based on models (Tbpred), minimal and maximal environmental temperatures (Temin and Temax). Three available body temperature lines are shown based on movements between thermal environments every 5, 15, and 30 minutes. Adapted from Christian et al., 2006.
Figure 7.15 Thermal images of snakes showing that the head region differs dramatically from the body in temperature during cooling. (A) The head of the tropical rattlesnake Crotalus durissus barely cools just following apnea. (B) Four seconds later, the head of the same snake is much cooler following inspiration. (C) A different rattlesnake just after a high level of activity (tail rattling), showing significant respiratory head cooling. (D) A python showing whole-head cooling following gaping behavior and rapid respiratory rates, leading to high rates of evaporative water loss. Adapted from Tattersall et al., 2006.
Figure 7.16 Brooding temperature in a python. Python molurus bivittatus generates heat by rapid contractions of skeletal muscle while brooding eggs. The rate of muscle contractions increases, oxygen intake increases, and CO2 production increases during egg brooding. Adapted from Van Mierop and Barnard, 1978.
Figure 7.17 Biophysical models can estimate the thermal limits available to an ectotherm in a specific habitat. When coupled with temperature data from free-ranging Galapagos land iguanas (Conolophus pallidus), trade-offs between achieving optimal temperatures and remaining active for longer periods at suboptimal temperatures demonstrate that the physical environment can determine patterns of space use. Adapted from Christian et al., 1983.
Figure 7.18 Thermoregulatory tactics vary among lizard species, but each habitat tends to have a mixture of active thermoregulators and passive thermoregulators. Species that are active thermoregulators tend to have high and relatively constant body temperatures throughout the day, whereas species that are passive thermoregulators tend to have lower body temperatures that fluctuate with environmental temperatures. Adapted from Pianka and Vitt, 2003.
Figure 7.19 The ability of amphibians and reptiles to acquire energy necessary to support life is determined by a combination of abiotic and biotic factors.Adapted from Dunham et al., 1989, and Niewiarowski, 1994.
Figure 7.20 Schematic diagram showing the protocol for developing ecologically meaningful energy budgets for amphibians and reptiles. Analytical methods can vary depending on the species studied and the specific question asked. Complete energy budgets require partitioning of energy into growth, maintenance, storage, and reproduction. All activities belong to one of these four compartments. Adapted from Congdon et al., 1982.
Figure 7.21 Effects of body mass and temperature on the rate of oxygen uptake (metabolic rate) in a reptile and an amphibian under two different thermal regimes. Amphibians have lower metabolic rates than reptiles even after the effects of size and temperature are removed. Data from Bennett, 1982, and Whitford, 1973.
Figure 7.22 Male spring peepers (Pseudacris crucifer) expend considerable energy calling to attract females during the breeding season. The rate of calling is related to reproductive success, which explains why males expend extra energy to call at higher rates. Adapted from Taigen et al., 1985.
Figure 7.23 The net cost of transport for snakes using lateral undulation is similar to that of lizards during locomotion. Concertina locomotion is much more expensive energetically, but sidewinding has a low energetic cost. Adapted from Secor et al. 1992.
Figure 7.24 The sidewinder Crotalus cerastes during locomotion on a sand dune. (C. Mattison)
Figure 7.25 The sidewinder, Crotalus cerastes (left), is a sit-and-wait predator investing little energy in prey search, whereas the coachwhip, Masticophis flagellum (right), is an active forager that spends considerable energy searching for prey. The coachwhip is eating an adult Dipsosaurus dorsalis. (C. c., S. C. Secor; M. f., J. M. Howland)
Figure 7.26 The sidewinder, a sit-and-wait predator, expends considerably less energy under natural field conditions than the coachwhip, an actively foraging predator. Year-long profiles of daily energy expenditures (averaged by month) are illustrated. Open symbols indicate field metabolic rates based on doubly labeled water measurements, and closed symbols indicate standard metabolic rates. Adapted from Secor and Nagy, 1994.
Figure 7.27 An hypothesis of physiological–ecological character state evolution in lizards in the genus Coleonyx. Four equally parsimonious hypotheses were found based on physiological data alone, but when coupled with biogeographic data, the other three were rejected. EWLR = evaporative water-loss rate, TP = temperature preference, SMR = standard metabolic rate, H = high, L = low. Solid bars indicate acquisition of a new state, and crosshatched bars indicate independent evolution of a derived state. The genera Eublepharis, Hemitheconyx, and Holodactylus make up the outgroup. Presumably, a shift occurred in the selective regime (SR) from an energy-rich to an energy-poor microhabitat during the evolutionary history of Coleonyx. Adapted from Dial and Grismer, 1992.