Download
1 / 28
280 likes | 548 Vues
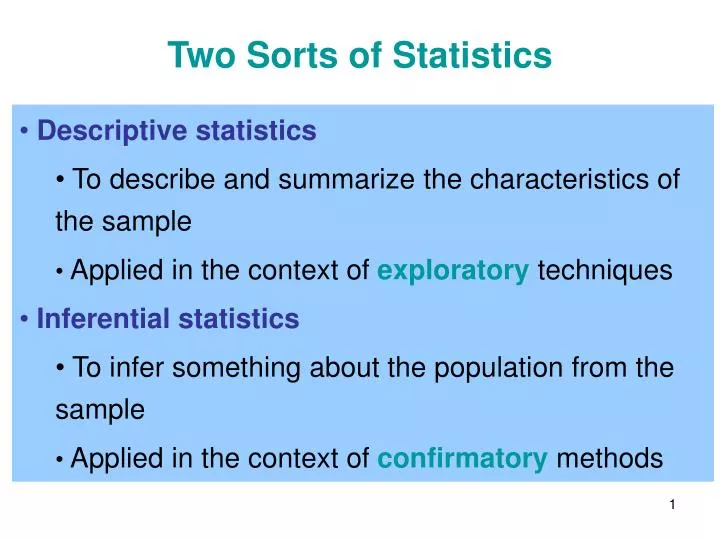
Two Sorts of Statistics . Descriptive statistics To describe and summarize the characteristics of the sample Applied in the context of exploratory techniques Inferential statistics To infer something about the population from the sample

E N D
Two Sorts of Statistics • Descriptive statistics • To describe and summarize the characteristics of the sample • Applied in the context of exploratory techniques • Inferential statistics • To infer something about the population from the sample • Applied in the context of confirmatory methods
From Descriptive to Inferential • We have to look at some aspects of the data we use first • The most important aspect of inferential statistics is the selection of the sample • A statistic is meaningless if the sample is not representative • We must consider: • Data Acquisition, Quality, & Collection Procedures • Sampling Design & Methods • (Spatial Sampling Approaches)
Data Acquisition • Any descriptive summaries that we form from a data set, or any inferences that we draw from the data set fundamentally reply upon the notion that the observations that the data record are an accurate reflection of the phenomenon of interest at the time they were taken • To have any confidence in the usefulness of a dataset, we need to be aware of how the data was collected, and by whom, and make use of that metadata to inform our judgment about how sound that source of data is for a given purpose
Data Acquisition • The fundamental distinction we can draw between sources of data is data that you have collected yourself, versus data that has been collected by others and archived • Collected - In many ways, this is the best sort of data because you can be absolutely certain of the methods used, although this can be expensive • Archived - Has the competing merit of already being available, possibly having been collected over a period of time, and others have undertaken the expense of doing so
Collected Data • Collected Data - a.k.a. primary data, is collected directly by the researcher through experiments, measurements, field surveys etc. • Benefits: Total certainty as to methods used and error associated with them, can be customized to the research question, the methods can be precisely repeated on another occasion or in another location • Drawbacks: Collecting data is expensive, there may not be a comparable historical record of similar measurements, gives critics an opportunity to criticize your data collection as well!
Collected Data • Collected Data Cont. - We can further sub-divide collected data into categories that denote the sort of collection procedure used to produce the data: • Experimental (controlled experiment) data is produced under repeatable conditions and is presumably an objective description of some phenomenon (often used in physical geography) • Non-experimental data, such as interview or questionnaires are used to assess more qualitative or subjective ideas or concepts (often applied in the human geography context)
Archived Data • Archived Data - Data that is already available because it has been collected by someone else • Benefits: The expense of collecting the data has been absorbed already, the methods used are often a standard approach that allows for inter-comparison with historical records or records for other places • Drawbacks: One cannot be as sure of the data quality, methods and associated errors here (sometimes metadata is not available), the variable of interest may not be available, or your definition may vary slightly from that used by others
Archived Data • Archived Data cont. - We can characterize archived data as being internal (meaning it was collected by another member of your organization), or external (meaning it was collected by someone you do not know as well) … we can call these: • Secondary data, which is obtained directly from those that did collect the data • Tertiary data, which we can obtain from a third-party (sometimes via publication, sometimes not), often this is data which has already been analyzed or transformed somehow
Data Quality • The further removed we are from those that actually collect and create a data set, the worse off we are when using that data • The results of any statistical study are only as good as the data that was used, thus the quality of the data is very important because it in turn determines the quality and reliability of descriptions and inferences based upon it • Data obtained externally should be used only after a serious investigation and consideration of its quality and reliability
Data Collection Procedures • The errors associated with data often are a function of how they were collected (instruments used), e.g.: • The USGS coordinates a cooperative network of stream flow gauges, and while many of these instruments are maintained directly by USGS employees, others are operated by universities, research stations, local water authorities etc.
Data Collection Procedures • Some may have a weir and floating level that records flow, others rotating current meters, or acoustic Doppler meters, or electromagnetic flow meters; each of these has different degrees of accuracy … some require more maintenance • If we are going to compare stream flow data from multiple catchments, we need to know of these differences
Data Collection Procedures • This applies to data in human geography too: • For example, when a government takes a census, what criteria does it use for who gets counted? Does a person have to be in their home on the day of the census to be included? What if we compare data from different countries? • Population figures are then in turn used to calculate per capita figures like GNPP or cost of living information … the definition of what persons are included matters • Likewise, suppose we are comparing city populations of urban centers. Do both urban centers use the same definition of what is included within the city? What about change over time and annexations … definitions matter!
Data Collection Procedures • Procedural choices made in data aggregation, data omissions, and the rounding of figures in the course of collection can all vary and have an impact on how the data portrays some variable • These issues are further compounded if a data set is created by merging multiple data sets which were procured from different sources (and likely produced according to different procedures and standards): • Ideally, the provenance of a data set must be known so the procedures used to collect the data are known by those who would analyze it, and any choices made at the time of the data collection can be taken into account
Sampling Populations • Typically, when we collect data, we are somewhat limited in the scope of what information we can reasonably collect • Ideally, we would enumerate each and every member of a population so we could know its parameters perfectly • In most cases this is not possible, because of the size of the population (infinite populations?) and associated costs (time, money, etc.) • Usually it is not necessary, because by collecting data on an appropriate subset of the population we can create statistics that are adequate estimates of population parameters • Instead, we sample a population, trying to get information about a representative subset of the population
Sampling Concepts • We must define the sampling unit - the smallest sub-division of the population that becomes part of our sample • We want to minimize sampling error when we design how we will collect data: Typically the sampling error ¯ as the sample size because larger samples make up a larger proportion of the population (and a complete census, for example, theoretically has no sampling error) • We want to try and avoid sampling bias when we design how we will collect data: Bias here is referring to a systematic tendency in the selection of members of a population to be included in a sample, i.e. any given member of a population should have an equal chance of being included in the sample (for random sampling)
Steps in Sampling • Definition of the population - We first need to identify the population we wish to sample, and do so somewhat formally because any inferences we draw are really only applicable to that population • Construction of a sampling frame - This involves identifying all the individual sampling units within a population in order that the sample can be drawn from them. In a survey-type study, this could involve procuring a list of all the potential individuals who could be included in a sample. In my research, this involved mapping the terrain of suburban watersheds so locations within the watersheds could be selected for soil moisture readings … a means to select which units to sample
Steps in Sampling Cont. • Selection of a sampling design - This is a critical decision about how to collect the sample. We will look at some different sampling designs in the following slides • Specification of information to be collected - The formal definition of what data we will collect and how (i.e. what questions are on the survey, at what depth will the we use the soil moisture probe). Often, a pilot sample is conducted to refine the sampling design and specifications to help minimize biases that only become apparent once the sampling design and specs are tested • Collection of the data - When we have steps 1-4 straight, we go about collecting the sample
Types of Samples (Designs) • We can distinguish between two families of sampling designs: • Non-probability designs are not concerned with being representative by virtue of minimizing bias, are typically used for non-scientific purposes, and are not appropriate for statistical inference studies, although they can be useful in an investigative sense • Probability designs aim to representative of the population they sample, follow rules of randomness in selection to minimize bias, and are those that are used in scientific studies were inferential statistics will be used • (We will primarily concerns ourselves with the latter)
Non-probability Sampling Designs • Some types of non-probability designs: • Volunteer sampling - A ‘self-selecting’ sample, which is convenient, but rarely representative • Quota sampling - Researchers select individuals to include based on fulfilling counts of sub-groups • Convenience sampling - Individuals are included in the sample because they are available/accessible • Judgmental or purposive sampling - Those that are chosen to be included in the sample are chosen based upon some preconceived notions of what sorts of individuals would be most appropriate for this investigative purpose (e.g. product testing based on ideas about the market for a product)
Probability Sampling Designs - Random • Random sampling - In general, we need some degree of randomness in the selection of a sample to be able to draw any meaningful inferences about a population, but in some cases this may conflict with representativeness • These are drawn in such a way that every unit of a population has an equal chance of being chosen and the selection of one unit has no impact on whether or not another individual will be selected (independence) • This can be done with or without replacement (which determines whether the same unit can be drawn twice) • We can generate random numbers using a table (A.1 on pp. 212-213), or using a computer, and can scale the 0 to 1 values to any required range of values
Probability Sampling Designs - Systematic • Representative approaches place restrictions on selection: • Systematic sampling - This approach uses every kth element of the sampling frame, by beginning at a randomly chosen point in the frame, e.g. given a sampling frame of size = 200, to create a sample of size n=10 from such a sample, select a random point to begin within the frame and then include every 20th value in the systematic sample • This approach assumes that the assignment of the individuals in the sampling frame is random (i.e. they have not been placed in the frame in some order or grouping), and this should be checked before systematically sampling from a frame
Probability Sampling Designs - Systematic • Some problems with systematic sampling: • The possible values of sample size n are somewhat restricted by the size of the sampling frame, since the interval should divide evenly into the size of the sampling frame • If the population itself exhibits some periodicity, then a stratified sample is likely to not be representative • In geographic applications, with could be applied in 2 dimensions in (x,y) space with with Dx and Dy (which are not necessarily the same) specifying a systematic grid, but the sample size is still restricted by the extent of the study area (since the grid must fit evenly)
Probability Sampling Designs - Stratified • We may need to place restrictions on how we select units for inclusion in a sample to ensure a representative sample. • Stratified sampling - Divide the population into categories and select a random sample from each of these • This approach can be used to decrease the likelihood of an unrepresentative sample if the classes/categories/strata are selected carefully (the individuals within a strata must be very much alike, which means that the population must be able to divided into relatively homogeneous groups) • We need to know something about the population in order to make good decisions about stratification
Probability Sampling Designs - Stratified • We can take a stratified sample that is • Proportional - Where the random sample drawn from each class/category/stratum is the same sizeOR • Disproportional - Where random samples of different sizes are drawn from each class/category/stratum, with the sample size usually being chosen on the basis of the size of that sub-population. This approach is best used when the sizes of the categories are significantly different, although it can also be applied to mitigate cost issues (i.e. it may be more costly to sample in a swamp than in a grassy field, so we might choose to take less samples in the swamp, although this clearly would be nothing to enhance representativeness in our sample)
Probability Sampling Designs - Stratified • WARNING: • A class/category/stratum that is homogeneous with respect to one variable may have high variation with respect to another variable! Thus, stratification must be performed with some foreknowledge of how the sample will be analyzed, and if the sampling is being performed in a preliminary fashion (still seeking the relationships), there is a danger that the stratification will be found to be inappropriate after the fact • E.g. my soils sampling may have been stratified with respect to TMI, but if I want to check if upstream land-use is a factor in Glyndon, I may find my samples are not representatively distributed with respect to land use
Probability Sampling Designs - Cluster • Another sampling approach that subdivides the population into categories is cluster sampling • Cluster sampling - Divides the population into categories based on convenience rather than some structure designed to promote unbiased representation of a particular variable across all clusters, and sampling is performed within individual clusters • Certain clusters are selected for intensive study, usually by a random procedure, and the content of clusters should each be individually be heterogeneous (a cross-section of the range of values seen in the whole population), and thus representative • This is usually applied for reasons of cost and convenience
Choosing a Sampling Design • In a geographic context: • Stratified sampling works best if the regions are reasonably homogeneous • Cluster sampling works best if the regions are heterogeneous • From an efficiency point of view (the number of samples required), stratified sampling is best since it can be representative using a smaller number of samples, but if there is no clear means of rational stratification, then clustering might be the way to go • Many sampling designs are hybrids of approaches (e.g. stratify by ethnic group, cluster to pick neighborhoods, select houses randomly)
Random Spatial Sampling • We can choose a random point in (x,y) space by choosing pairs of random numbers … this produces a Poisson distribution if we divide the area into quadrats and count • This is easy with rectangular study areas, otherwise we also need to reject any points outside the study area (e.g. my method for selecting the beginning of a transect) • We can also produce stratified and systematic point samples by dividing the area into a group of mutually exclusive and collective exhaustive strata: