Download
1 / 21
210 likes | 636 Vues
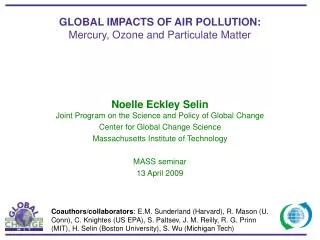
Global Impacts of Asian Pollution on Nitric Acid Deposition and NO x and Ozone Levels Meredith Galanter Department of Geosciences Princeton University Collaborators: Dr. Hiram (Chip) Levy II, GFDL/NOAA Bud Moxim, GFDL/NOAA Tracey Holloway, Princeton Univ.

E N D
Global Impacts of Asian Pollution on Nitric Acid Deposition and NOx and Ozone Levels Meredith Galanter Department of Geosciences Princeton University Collaborators: Dr. Hiram (Chip) Levy II, GFDL/NOAA Bud Moxim, GFDL/NOAA Tracey Holloway, Princeton Univ. Dr. Larry Horowitz, Princeton Univ. Dr. Mahesh Phadnis, Princeton Univ. Dr. Gregory R. Carmichael, Univ. of Iowa
Outline Introduction Model Overview - Comparison with observations - NOx surface sources Present (1990) CO, NOx, O3 Levels Future (2030) Asian Impacts - Global Tropospheric NOxand O3 - Episodic Impacts Asian Impacts on HNO3 Deposition - Global vs Asian contribution - Present - Global vs Asian contribution - Future - Totals for N. Pacific, N. Atlantic, and Indian Oceans - Pacific Nitrogen Budget Summary/Conclusions
Why is there concern about Asian pollution? • - Current rate of development = Drastic increases in emissions • - Transport of trace gases and aerosols effects background • chemistry of remote Pacific troposphere • - Growing observational evidence of impact on N. America The above depicts how Asia is defined on the model grid.
Overview of Study • - The episodic nature of air pollution transport from Asia to North America: Yienger et al., JGR, 105: 26931-26945, 2000. • - Present (1990) impact on CO, NOx, and O3 • - Future (~2030) impact on CO, NOx, and O3 • - Track Asian pollution by source (i.e. fossil fuel burning, biomass burning, biofuels) • - Analysis of regional/national emissions and their impact (e.g. India vs. China vs. rest of Asia) • - Detailed analysis and comparison with observations in Asian region • - Analysis of changes in HNO3 deposition related to increases in NOx emissions from Asia
GFDL Global Chemical Transport Model (GCTM) Overview • - 11 sigma levels; 7 in troposphere • - ~ 265 km x 265 km • - 2.4ox2.4o in tropics and 3o-3.5ox2.4o in midlats • - 1 year of 6-hr time averaged GCM wind, • temp., and precip. fields • - no diurnal cycle • - North Pacific mean circulation and storm • track realistically simulated • - CO and NOx run as separate simulations, • output then used as input for O3 simulation
GFDL Global Chemical Transport Model • (GCTM) Chemistry Overview • NOx • - explicit treatment of three tracers: NOx, PAN, HNO3 • - first order rate coefficients calculated off-line • - sources of NOx: • fossil fuel combustion • biomass burning • soil-biogenic emissions • lightning discharge • aircraft emissions • stratospheric injection • (see Mahlman and Moxim, J. Atmos. Sci., 1978; Levy et al., JGR, 1999) • CO • - CO destruction by OH acts as sink • - sources of CO: • fossil fuel combustion • biomass burning • biogenic HC oxidation • methane oxidation • (see Holloway et al., JGR, 2000) • O3 • (see Yienger et al., 1999; Levy et al., 1997; Klonecki and Levy, 1997)
Although both biomass burning and fossil fuel combustion are important anthropogenic emission sources, it is fossil fuel emissions which are expected to grow most rapidly in Asia, and which respond most directly to energy policy initiatives.Asia's fossil fuel emissions of NOx are predicted to quadruple between 1990 and 2030 under a no-further-control scenario based on the projections of van Aardenne et al. [Atm. Environ.,1999].
The 1990 base case fields of CO, NOx, and O3 from the GFDL GCTM are shown above for the surface and 500 mbar. Not surprisingly, the largest concentrations (in ppbv) are seen in the largest source regions, e.g. North America, Asia, northern South America, and equatorial Africa.
To determine the contribution of Asian emissions to tropospheric NOx, CO, and O3, the CO and NOx simulations are run without Asian emissions and then subtracted from full source simulations; while the O3 simulation is run without the CO and NOx emissions from Asia and then compared to the full simulations.
Both increases in NOx and CO lead indirectly to increases in O3 production in the Asian region. In the middle troposphere Asia contributes an important 10 to 25% of the total springtime O3 in 2030 throughout the Northern Hemisphere (NH). More importantly for human and agricultural health, Asia's average impact on total O3 in 2030 near the surface increases to a significant 25 to 50% (10 to 20 ppbv - see next slide) across Asia south of 30oN and into the Pacific Ocean, as well as contributing 10 to 25% of total O3 throughout the NH.
Although the 1990 Asian impacts on average springtime O3 seems fairly insignificant for North American air quality, the next series of slides will show that episodes of “Asian O3” reaching the west coast of the United States may have a more significant impact. The results of the model simulation agree very well with observations taken at CPO and Trinidad Head, CA (see next slide) [Jaffe et al., GRL, 1999; see Yienger et al., JGR, 2000 for further discussion].
Synoptic-scale episodic events are expected to increase in magnitude with the increases in energy use predicted for Asia and recent revisions to the U.S. national air quality standards for O3 (an 8-hour average of 80 ppbv not to be exceeded more than 3 times per year) may give this trans-Pacific transport of Asian emissions an important role in future U.S. air quality. The above illustrates the total O3 and Asian O3 occurring over southern California from the 2030 simulation. The dashed line in the figure marks 80 ppbv, showing that southern California would be reaching and/or breaking the new air quality standard at least 10 times just during the spring months with Asian O3 contributing importantly to 5 of these events.
Focus on HNO3Deposition • - What is the present contribution of HNO3 deposition to the Pacific Ocean N budget? • - What is the contribution of Asian emissions to HNO3 deposition? • - How will these contributions change with increased Asian emissions in the future? Beyond air quality, anthropogenic emissions from Asia also have the potential to significantly impact the historically clean troposphere over the Pacific leading to possible changes in background tropospheric chemistry. In addition, the large increases in NOx emissions will not only affect production of O3 but will also lead to large increases in nitric acid (HNO3) deposition in the major ocean basins, impacting the biogeochemical cycling of nitrogen in marine and coastal ecosystems.
The Pacific Ocean nitrogen budget is in balance with approximately 54 Tg N/yr input into the system from nitrogen fixation, 10 Tg N/yr input from atmospheric deposition (including reduced forms of HNO3), and then 63 Tg N/yr output from the system by the process of denitrification and the final 1 Tg N/yr transported out of the region [Deutsch et al., GBC, 2001]. Based on this budget, atmospheric deposition of HNO3 and its reduced species makes up 15% of the Pacific nitrogen budget at present. In the 2030 scenario of increased Asian emissions of NOx the amount of HNO3 deposition to the Pacific more than doubles, with Asia contributing 70%. Although it is uncertain how nitrogen fixation and denitrification will change as a result of the increased nitrogen input, it is certain that this increase will affect ecosystems particularly in the North Pacific.
Summary/Conclusions • - Asian emissions have an important impact throughout the NH • - 2030 Asian emissions will generate episodes of “Asian O3” in • the BL over North America: • 30-40 ppbv in spring • 10-20 ppbv in summer • - North American air quality will become more significantly • impacted by Asian emissions in the next few decades - more • impact from synoptic scale episodes than from a relatively • steady increase in background O3 levels • - Trans-Pacific events may well aggravate local pollution • enough to violate air quality standards for O3 • - Anthropogenic emissions of air pollutants have potential to • significantly impact the historically clean troposphere over the • Pacific Ocean • alter chemistry (e.g. oxidizing capacity) • change the albedo of the North Pacific
Summary/Conclusions (cont.) • - Pacific Ocean (32oS - 65oN): • Total HNO3 deposition is 6 Tg/yr in 1990 • Asian emissions contributing 50% • HNO3 depo + reduced species =15% of total inputs to • Pacific N budget • Total HNO3 deposition is 14 Tg/yr in 2030 • Asian emissions contributing 70% • - Indian Ocean (from 32oS) • Total HNO3 deposition is 1.6 Tg/yr in 1990 • Asian emissions contributing 45% • Total HNO3 deposition is 4.2 Tg/yr in 2030 • Asian emissions contributing 75%