Download
1 / 17
180 likes | 433 Vues
Organizing Data. 4.2. Warm Up. Compare. Write < or >. 1. 3(6) 15 2. 53 – 37 19 3. 27 2(14) 4. 49 – (–4) 51. >. <. <. >. Learn to organize data in tables and stem-and-leaf plots. Vocabulary. stem-and-leaf plot back-to-back stem-and-leaf plot.

E N D
Organizing Data 4.2
Warm Up Compare. Write < or >. 1.3(6) 15 2. 53 – 37 19 3. 27 2(14) 4. 49 – (–4) 51 > < < >
Vocabulary stem-and-leafplot back-to-back stem-and-leafplot
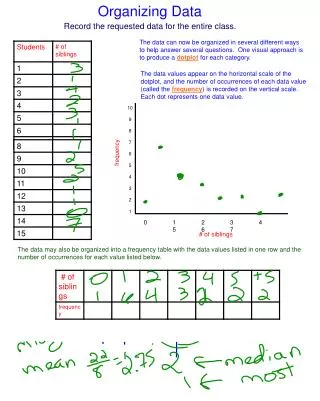
When you graduate and start looking for a job, you may have to keep track of a lot of information. A table is one way to organize data so that you can understand the meaning and recognize any relationships.
Example: Organizing Data in Tables Use the given data to make a table. Jack timed his bus rides to and from school. On Monday, it took 7 minutes to get to school and 9 minutes to get home. On Tuesday, it took 5 minutes and 9 minutes, respectively, and on Wednesday, it took 8 minutes and 7 minutes.
Try This Use the given data to make a table. Jill timed herself jogging to the park and back home. On Monday she ran to the park in 12 minutes then back home in 14 minutes, on Tuesday it took her 13 and 15 minutes, respectively, and on Wednesday, it took her 11 minutes and 13 minutes.
2 5 = 25 Stem-and-Leaf Plot A stem-and-leaf plot is another way to display data. The values are grouped so that all but the last digit is the same in each category. Stem = first digits(s) Leaf = last digit
Example: Reading Stem-and-Leaf Plots List the data values of the stem-and-leaf plot. 1 2 5 4 0 1 1 5 2 7 9 Key: 1 2 means 12 The data values are: 12, 15, 40, 41, 41, 52, 57, and 59.
Try This List the data values of the stem-and-leaf plot. 2 3 6 3 7 8 9 4 2 5 6 Key: 2 3 means 23 The data values are: 23, 26, 37, 38, 39, 42, 45, and 46.
Example: Organizing data in Stem-and-Leaf Plots Use the given data to make a stem-and-leaf plot. Key: 4 2 means 42 mi/h 4 2 3 5 5 0 6 1 4 Speeds range from 42 to 64 so stems are 4 to 6.
Try This Use the given data to make a stem-and-leaf plot. Key: 2 3 means 23% 2 3 5 7 7 8 3 0 Percentage range from 23 to 30 so stems are 2 to 3.
Back-to-Back Stem-and-Leaf Plot A back-to-back stem-and-leaf plot is used to compare two sets of data. The stems are in the center, and the left leaves are read in reverse.
Example: Organizing data in Back-to-Back Stem-and-Leaf Plots Use the given data to make a back-to-back stem-and-leaf plot. 1950 2000 Key: | 2 | 9 means 29 representatives 8 | 1 | means 18 representatives 1 2 3 4 4 8 0 5 9 9 5 1 3 9
Try This Use the given data to make a back-to-back stem-and-leaf plot. Did not vote Voted 8 5 5 8 4 1 0 0 8 1 0 2 6 6 2 3 4
Lesson Quiz: Part 1 Use the given data to make a table. 1. There are three houses. The first house has 3 bedrooms, 2 bathrooms, and a full basement. The second house has 4 bedrooms, 3 bathrooms, and a partial basement. The third house has 5 bedrooms, 2.5 bathrooms, and no basement. 4 5 3 3 2 2.5 Partial Full None
Lesson Quiz: Part 2 2. List the data values in the stem-and-leaf plot. Key: 1 5 means 15 0 6 9 1 4 7 2 2 5 6, 9, 14, 17, 22, 25