Download
1 / 1
10 likes | 99 Vues
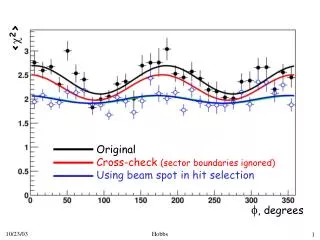
5%. Comparison of Solar Spectra from NOAA-16 and SSBUV. 3%. 350 nm. 250 nm. Wavelength.

E N D
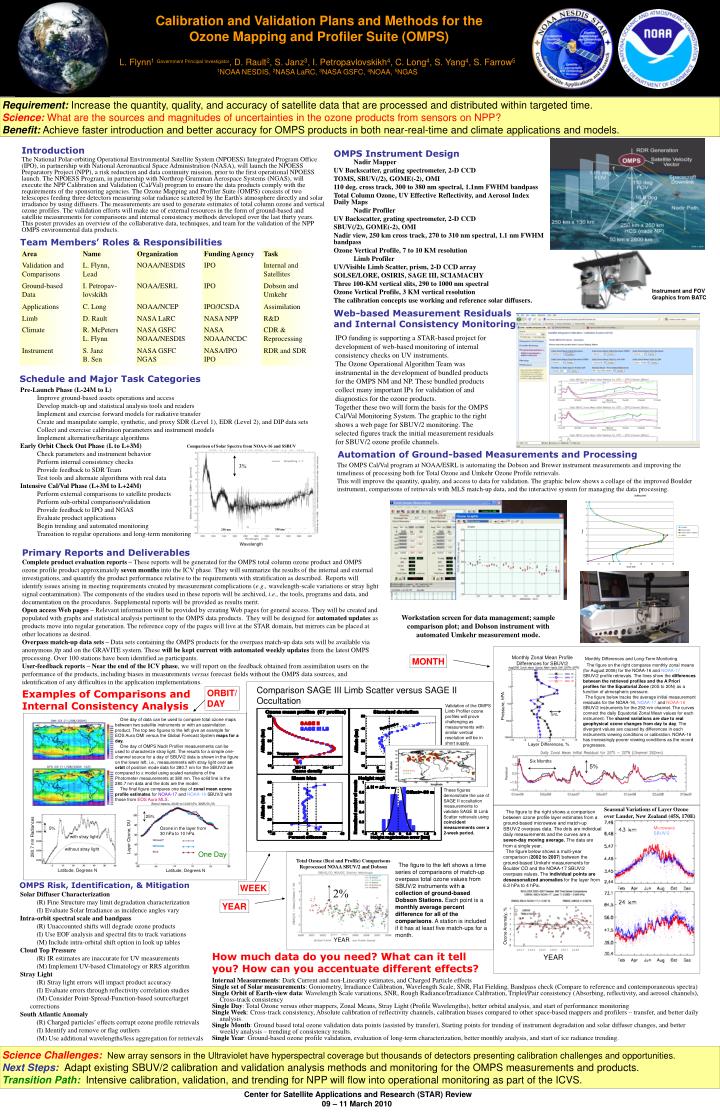
5% Comparison of Solar Spectra from NOAA-16 and SSBUV 3% 350 nm 250 nm Wavelength One day of data can be used to compare total ozone maps between two satellite instruments or with an assimilation product. The top two figures to the left give an example for EOS Aura OMI versus the Global Forecast System maps for a day. One day of OMPS Nadir Profiler measurements can be used to characterize stray light. The results for a simple one-channel source for a day of SBUV/2 data is shown in the figure on the lower left, i.e., measurements with stray light over an orbit of position mode data for 280.7 nm for the SBUV/2 are compared to a model using scaled variations of the Photometer measurements at 380 nm. The solid line is the 280.7 nm data and the dots are the model. The final figure compares one day of zonal mean ozone profile estimates for NOAA-17 and NOAA-16 SBUV/2 with those from EOS Aura MLS. Comparison SAGE III Limb Scatter versus SAGE II Occultation Monthly Zonal Mean Profile Differences for SBUV/2 Monthly Differences and Long-Term Monitoring The figure on the right compares monthly zonal means (for August 2006) for the NOAA-16 and NOAA-17 SBUV/2 profile retrievals. The lines show the differences between the retrieved profiles and the A Priori profiles for the Equatorial Zone (20S to 20N) as a function of atmospheric pressure. The figure below tracks the average initial measurement residuals for the NOAA-16, NOAA-17 and NOAA-18 SBUV/2 instruments for the 292-nm channel. The curves connect the daily Equatorial Zonal Mean values for each instrument. The shared variations are due to real geophysical ozone changes from day to day. The divergent values are caused by differences in each instruments viewing conditions or calibration. NOAA-16 has increasingly poorer viewing conditions as the record progresses. Validation of the OMPS Limb Profiler ozone profiles will prove challenging as measurements with similar vertical resolution will be in short supply. Pressure, hPA 25% Layer Differences, % These figures demonstrate the use of SAGE II occultation measurements to validate SAGE III Limb Scatter retrievals using coincident measurements over a 2-week period. Layer Ozone, DU Seasonal Variations of Layer Ozone over Lauder, New Zealand (45S, 170E) The figure to the right shows a comparison between ozone profile layer estimates from a ground-based microwave and match-up SBUV/2 overpass data. The dots are individual daily measurements and the curves are a seven-day moving average. The data are from a single year. The figure below shows a multi-year comparison (2002 to 2007) between the ground-based Umkehr measurements for Boulder CO and the NOAA-17 SBUV/2 overpass values. The individual points are deseasonalized anomalies for the layer from 6.3 hPa to 4 hPa. 5% Ozone in the layer from 30 hPa to 10 hPa Six Months with stray light 280.7 nm Radiances 5% Microwave SBUV/2 without stray light One Day Total Ozone (Best and Profile) ComparisonsReprocessed NOAA SBUV/2 and Dobson The figure to the left shows a time series of comparisons of match-up overpass total ozone values from SBUV/2 instruments with a collection of ground-based Dobson Stations. Each point is a monthly average percent difference for all of the comparisons. A station is included if it has at least five match-ups for a month. Latitude, Degrees N Latitude, Degrees N 2% Ozone Anomaly, % YEAR 2003 2004 2005 2006 2007 2008 YEAR Calibration and Validation Plans and Methods for the Ozone Mapping and Profiler Suite (OMPS) L. Flynn1Government Principal Investigator, D. Rault2, S. Janz3, I. Petropavlovskikh4, C. Long4, S. Yang4, S. Farrow5 1NOAA NESDIS, 2NASA LaRC, 3NASA GSFC, 4NOAA, 5NGAS Requirement: Increase the quantity, quality, and accuracy of satellite data that are processed and distributed within targeted time. Science: What are the sources and magnitudes of uncertainties in the ozone products from sensors on NPP? Benefit: Achieve faster introduction and better accuracy for OMPS products in both near-real-time and climate applications and models. Introduction OMPS Instrument Design The National Polar-orbiting Operational Environmental Satellite System (NPOESS) Integrated Program Office (IPO), in partnership with National Aeronautical Space Administration (NASA), will launch the NPOESS Preparatory Project (NPP), a risk reduction and data continuity mission, prior to the first operational NPOESS launch. The NPOESS Program, in partnership with Northrop Grumman Aerospace Systems (NGAS), will execute the NPP Calibration and Validation (Cal/Val) program to ensure the data products comply with the requirements of the sponsoring agencies. The Ozone Mapping and Profiler Suite (OMPS) consists of two telescopes feeding three detectors measuring solar radiance scattered by the Earth's atmosphere directly and solar irradiance by using diffusers. The measurements are used to generate estimates of total column ozone and vertical ozone profiles. The validation efforts will make use of external resources in the form of ground-based and satellite measurements for comparisons and internal consistency methods developed over the last thirty years. This poster provides an overview of the collaborative data, techniques, and team for the validation of the NPP OMPS environmental data products. Nadir Mapper UV Backscatter, grating spectrometer, 2-D CCD TOMS, SBUV(/2), GOME(-2), OMI 110 deg. cross track, 300 to 380 nm spectral, 1.1nm FWHM bandpass Total Column Ozone, UV Effective Reflectivity, and Aerosol Index Daily Maps Nadir Profiler UV Backscatter, grating spectrometer, 2-D CCD SBUV(/2), GOME(-2), OMI Nadir view, 250 km cross track, 270 to 310 nm spectral, 1.1 nm FWHM bandpass Ozone Vertical Profile, 7 to 10 KM resolution Limb Profiler UV/Visible Limb Scatter, prism, 2-D CCD array SOLSE/LORE, OSIRIS, SAGE III, SCIAMACHY Three 100-KM vertical slits, 290 to 1000 nm spectral Ozone Vertical Profile, 3 KM vertical resolution The calibration concepts use working and reference solar diffusers. Team Members’ Roles & Responsibilities Instrument and FOV Graphics from BATC Web-based Measurement Residuals and Internal Consistency Monitoring IPO funding is supporting a STAR-based project for development of web-based monitoring of internal consistency checks on UV instruments. The Ozone Operational Algorithm Team was instrumental in the development of bundled products for the OMPS NM and NP. These bundled products collect many important IPs for validation of and diagnostics for the ozone products. Together these two will form the basis for the OMPS Cal/Val Monitoring System. The graphic to the right shows a web page for SBUV/2 monitoring. The selected figures track the initial measurement residuals for SBUV/2 ozone profile channels. Schedule and Major Task Categories • Pre-Launch Phase (L-24M to L) • Improve ground-based assets operations and access • Develop match-up and statistical analysis tools and readers • Implement and exercise forward models for radiative transfer • Create and manipulate sample, synthetic, and proxy SDR (Level 1), EDR (Level 2), and DIP data sets • Collect and exercise calibration parameters and instrument models • Implement alternative/heritage algorithms • Early Orbit Check Out Phase (L to L+3M) • Check parameters and instrument behavior • Perform internal consistency checks • Provide feedback to SDR Team • Test tools and alternate algorithms with real data • Intensive Cal/Val Phase (L+3M to L+24M) • Perform external comparisons to satellite products • Perform sub-orbital comparison/validation • Provide feedback to IPO and NGAS • Evaluate product applications • Begin trending and automated monitoring • Transition to regular operations and long-term monitoring Automation of Ground-based Measurements and Processing The OMPS Cal/Val program at NOAA/ESRL is automating the Dobson and Brewer instrument measurements and improving the timeliness of processing both for Total Ozone and Umkehr Ozone Profile retrievals. This will improve the quantity, quality, and access to data for validation. The graphic below shows a collage of the improved Boulder instrument, comparisons of retrievals with MLS match-up data, and the interactive system for managing the data processing. Primary Reports and Deliverables Complete product evaluation reports – These reports will be generated for the OMPS total column ozone product and OMPS ozone profile product approximately seven months into the ICV phase. They will summarize the results of the internal and external investigations, and quantify the product performance relative to the requirements with stratification as described. Reports will identify issues arising in meeting requirements created by measurement complications (e.g., wavelength-scale variations or stray light signal contamination). The components of the studies used in these reports will be archived, i.e., the tools, programs and data, and documentation on the procedures. Supplemental reports will be provided as results merit. Open access Web pages – Relevant information will be provided by creating Web pages for general access. They will be created and populated with graphs and statistical analysis pertinent to the OMPS data products. They will be designed for automated updates as products move into regular generation. The reference copy of the pages will live at the STAR domain, but mirrors can be placed at other locations as desired. Overpass match-up data sets – Data sets containing the OMPS products for the overpass match-up data sets will be available via anonymous ftp and on the GRAVITE system. These will be kept current with automated weekly updates from the latest OMPS processing. Over 100 stations have been identified as participants. User-feedback reports – Near the end of the ICV phase, we will report on the feedback obtained from assimilation users on the performance of the products, including biases in measurements versus forecast fields without the OMPS data sources, and identification of any difficulties in the application implementations. Workstation screen for data management; sample comparison plot; and Dobson instrument with automated Umkehr measurement mode. MONTH Examples of Comparisons and Internal Consistency Analysis ORBIT/ DAY OMPS Risk, Identification, & Mitigation WEEK • Solar Diffuser Characterization • (R) Fine Structure may limit degradation characterization • (I) Evaluate Solar Irradiance as incidence angles vary • Intra-orbit spectral scale and bandpass • (R) Unaccounted shifts will degrade ozone products • (I) Use EOF analysis and spectral fits to track variations • (M) Include intra-orbital shift option in look up tables • Cloud Top Pressure • (R) IR estimates are inaccurate for UV measurements • (M) Implement UV-based Climatology or RRS algorithm • Stray Light • (R) Stray light errors will impact product accuracy • (I) Evaluate errors through reflectivity correlation studies • (M) Consider Point-Spread-Function-based source/target corrections • South Atlantic Anomaly • (R) Charged particles’ effects corrupt ozone profile retrievals • (I) Identify and remove or flag outliers • (M) Use additional wavelengths/less aggregation for retrievals YEAR How much data do you need? What can it tell you? How can you accentuate different effects? Internal Measurements: Dark Current and non-Linearity estimates, and Charged Particle effects Single set of Solar measurements: Goniometry, Irradiance Calibration, Wavelength Scale, SNR, Flat Fielding, Bandpass check (Compare to reference and contemporaneous spectra) Single Orbit of Earth-view data: Wavelength Scale variations, SNR, Rough Radiance/Irradiance Calibration, Triplet/Pair consistency (Absorbing, reflectivity, and aerosol channels), Cross-track consistency Single Day: Total Ozone versus other mappers, Zonal Means, Stray Light (Profile Wavelengths), better orbital analysis, and start of performance monitoring Single Week: Cross-track consistency, Absolute calibration of reflectivity channels, calibration biases compared to other space-based mappers and profilers – transfer, and better daily analysis. Single Month: Ground based total ozone validation data points (assisted by transfer), Starting points for trending of instrument degradation and solar diffuser changes, and better weekly analysis – trending of consistency results. Single Year: Ground-based ozone profile validation, evaluation of long-term characterization, better monthly analysis, and start of ice radiance trending. Science Challenges:New array sensors in the Ultraviolet have hyperspectral coverage but thousands of detectors presenting calibration challenges and opportunities. Next Steps:Adapt existing SBUV/2 calibration and validation analysis methods and monitoring for the OMPS measurements and products. Transition Path:Intensive calibration, validation, and trending for NPP will flow into operational monitoring as part of the ICVS.