Download
1 / 9
90 likes | 262 Vues
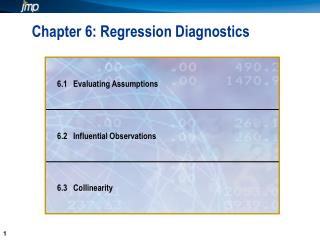
Regression Diagnostics. Regression Diagnostic asks 3 questions: Are the assumptions of multiple regression complied with? Is the model adequate? Is there anything unusual about any data points?. Checking for Non-violation of Assumptions.

E N D
Regression Diagnostics Regression Diagnostic asks 3 questions: • Are the assumptions of multiple regression complied with? • Is the model adequate? • Is there anything unusual about any data points?
Checking for Non-violation of Assumptions • Linearity of relationship between each X and Y can be checked by scatter plot of Y against each X. • Normality of distribution of Y data points can be checked by plotting a histogram of residuals. • Independence of explanatory variables from each other can be checked by scatter matrix, Variance Inflation Factor and Durbin-Watson statistic.
Diagnosis of Multi-collinearity • Check by means of correlation matrix • Significant F but non-significant t-ratios. • Variance Inflation. Large changes in regression coefficients when variables are added or deleted. • Variance Inflation Factor (VIF) > 4 or 5 suggests multi-collinearity; VIF > 10 is strong evidence that collinearity is affecting the regression coefficients. • Durbin – Watson statistic is another check for collinearity. (Normal value 0-4).
Diagnosis of Violation of Assumptions Residual Plots are used to check for: • Variance not being constant across the explanatory variables. • Fitted relationship not being linear. • Random variation not having a Normal distribution.
Fitted Values and Residuals • Fitted values (Fits) are the estimates of Y as determined by the regression equation. • Residuals (Resids) are the differences between each observed value and the corresponding fitted value.
Abnormal Patterns in Residual Plots • Figures a). and b). suggest non-linear relationship between X and Y. • Fig. c). Suggests autocorrelation. • Fig. d). Suggests variance is not the same since the spread of Y values is far greater for larger values of X.
Checking Unusual Data Points • Check for outliers long distance away from the rest of the data. They exercise leverage, which is checked by “hi”. It is considered large if more than 3 x p /n (p=number of predictors including the constant). Flagged by X in printout. • Cook’s Distance which measures the influence of a data point on the regression equation. Cook’s D > 1 requires careful checking; > 4 suggests potentially serious outliers.
Patterns of Outliers • a). Outlier is extreme in both X and Y but not in pattern. Removal is unlikely to alter regression line. • b). Outlier is extreme in both X and Y as well as in the overall pattern. Inclusion will strongly influence regression line • c). Outlier is extreme for X nearly average for Y. • d). Outlier extreme in Y not in X. • e). Outlier extreme in pattern, but not inX or Y.