Download
1 / 16
160 likes | 163 Vues
This study examines the vertical structure of radar reflectivity in eyewalls of hurricanes, analyzing how it changes with storm evolution and environmental conditions. The research utilizes data from the TRMM Precipitation Radar (PR) and NCAR Zebra software and applies Contoured Frequency by Altitude Diagrams (CFADs). The study also explores the impact of wind shear on the eyewall structure and investigates the influence of sea surface temperatures (SST). The findings highlight the importance of vertical wind shear in determining echo placement and intensity within the eyewall. Ongoing work aims to expand the analysis to other regions of the storm and cyclones in different basins worldwide.

E N D
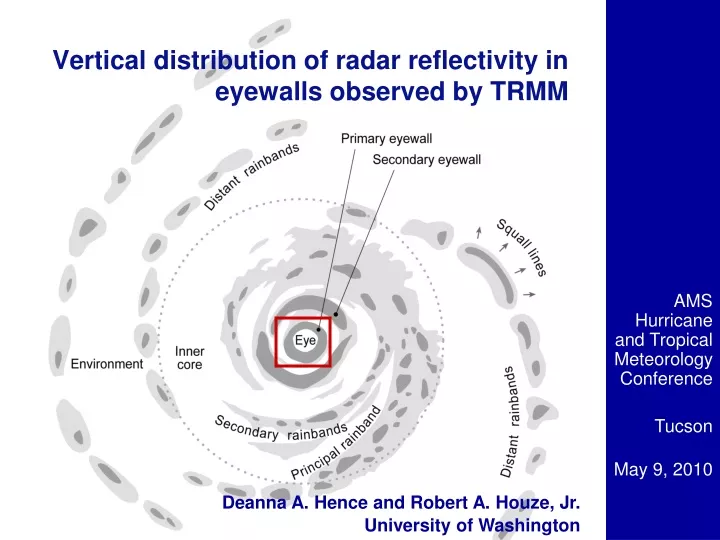
Vertical distribution of radar reflectivity in eyewalls observed by TRMM AMS Hurricane and Tropical Meteorology Conference Tucson May 9, 2010 Deanna A. Hence and Robert A. Houze, Jr. University of Washington
Inner rainband Inner rainband Deep Restricted Deep Idealized vertical structures suggested by past studies Outer rainband Outer rainband How does the eyewall structure change with storm evolution and environmental conditions? From Houze et al. (2007)
Relative frequency of occurrence Primary Analysis Tools • TRMM Precipitation Radar (PR) • NCAR Zebra software • Contoured Frequency by Altitude Diagrams (CFADs) Yuter and Houze 1995, Houze et al. 2007 From NASA TRMM website (http://trmm.gsfc.nasa.gov/)
Annuli and Quadrant Analysis TRMM PR Maximum Reflectivity at 03:26 on 28 August 2005 • From the National Hurricane Center (NHC) best track data • Center location • Eye diameter • Storm motion UR UL Reflectivity (dBZ) DR Shear Vector DL
DR DL peak of low-level distribution Shear UL UR Track Raw Number CFADs, Not Normalized, All Overpasses 120 60 10
How shear affects the eyewall UL DL UL shear shear UR DL DR UR DR From Black et al. (2002) From Braun et al. (2006) Updrafts initiating just upwind of the downshear-left quadrant
Vertical structure in weaker and stronger storms CAT4,5 CAT1,2 • Greater reflectivity overall • More extreme outliers intermittent intense cells Total Eyewall Annulus, Normalized
Vertical structure over cooler and warmer water Marginal SST (26-28 °C) High SST (>28 °C) • Majority of distribution similar Total Eyewall Annulus, Normalized • Outliers much stronger and higher in high SST cases
1.0 0.5 Track 0.2 Normalized CFADs, All Overpasses DR No brightband, broad upper levels DL Brightband appears Shear UL Weaker overall, no distinct peak UR Brightband intensifies
1.0 0.5 Track 0.2 Normalized CFADs, High SST DR Weakening DL Tighter Distribution More distinct brightband Shear UL Weakening Strengthening UR
Conclusions • Vertical wind shear • Determines echo placement around the eyewall • Cat. 4 and 5 storms • More intense • More intermittent intense cells • Lower SST values • Suppress intense outliers • Doesn’t change the mean reflectivity distribution • Track motion ≥ shear, opposite in direction • echo formation region shifts upshear right
Ongoing Work • Expand analyses to rainband and outer regions • Expand analyses to intense cyclones in worldwide basins
1.0 0.5 Track 0.2 Normalized CFADs, High SST DR Weakening DL Tighter Distribution More distinct brightband Shear UL Weakening Strengthening UR
Narrowing of upper levels 1.0 0.5 0.2 Normalized CFADs, Low Shear DR DL Tighter Distribution More distinct brightband Shear UL Weakening Strengthening UR Track
This research was supported byNSF Grant ATM-0743180 and NASA Grants NNX07AD59G and NNX10AH70G