Download
1 / 29
290 likes | 363 Vues
Let’s Practice! x: { 3, 8, 1}. x 3 8 1. m 4 4 4. ( x -m) -1 4 -3. S( x -m) 2 = SS. ( x -m) 2 1 16 9. Find s :. S( x -m) 2 = 26. S( x -m) 2 N. =√(26/3). √. = 2.94. OR. ( S x) 2. __. __. SS = S x 2. S x = 12. x 3 8 1. x 2 9 64 1. S x 2 = 74. N.

E N D
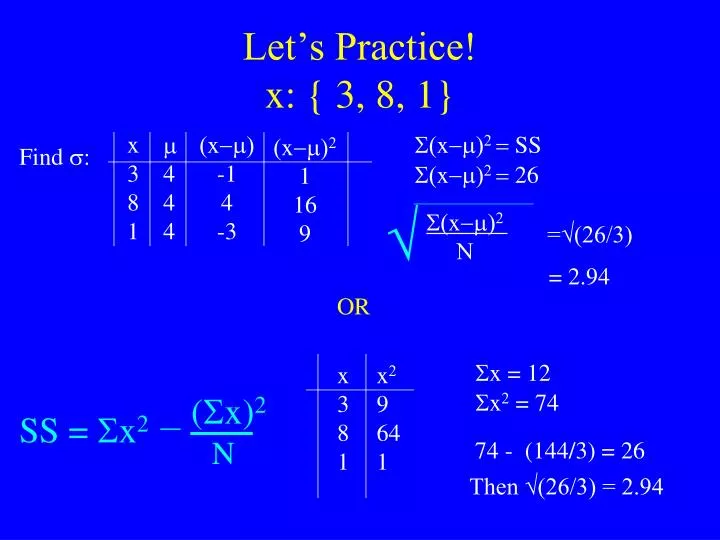
Let’s Practice! x: { 3, 8, 1} x 3 8 1 m 4 4 4 (x-m) -1 4 -3 S(x-m)2 = SS (x-m)2 1 16 9 Find s: S(x-m)2 = 26 S(x-m)2 N =√(26/3) √ = 2.94 OR (Sx)2 __ __ SS = Sx2 Sx = 12 x 3 8 1 x2 9 64 1 Sx2 = 74 N 74 - (144/3) = 26 Then √(26/3) = 2.94
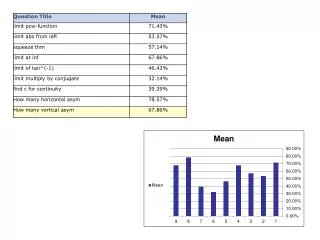
The Philosophy of Statistics & Standard Deviation Frequency 1.8 2.0 2.2 2.4 2.6 2.8 3.0 3.2 3.4 3.6 3.8 31500 31600 31700 31800 31900 32000 32100 32200 32300 32400 32500 GPA
The Philosophy of Statistics & Standard Deviation Proportion GPA
The Philosophy of Statistics & Standard Deviation Proportion 1.8 2.0 2.2 2.4 2.6 2.8 3.0 3.2 3.4 3.6 3.8 GPA
Example: IQs of Sample of Psychologists x - x z = s With some simple calculation we find: x = 140.33 s = 27.91 z(144) = [ 144 – 140.33]/ 27.91 z(198) = [ 198 – 140.33]/ 27.91 z(94) = [ 94 – 140.33]/ 27.91 ID IQ 1 128 2 155 3 135 4 134 5 144 6 101 7 167 8 198 9 94 10 128 11 155 12 145 = +0.13, “normal” = +2.07, abnormally high = -1.66, low side of normal
“forward” x - m z = s Forward and reverse transforms “reverse” x = m+z s Z- score Raw Score Raw score Z-score population x = x+z s x - x z = s sample Example: If population μ = 120 and σ =20 Find the raw score associated with a z-score of 2.5 x = 120 + 2.5(20) x = 120 + 50 x = 170
Why are z-scores important? • z-scores can be used to describe how normal/abnormal scores within a distribution are • With a normal distribution, there are certain relationships between z-scores and the proportion of scores contained in the distribution that are ALWAYS true. • 1. The entire distribution contains 100% of the scores • 2. 68% of the scores are contained within 1 standard deviation below and above the mean • 3. 95% of the scores are contained within 2 standard deviations below and above the mean
m= 128 s = 32 95% 68% Z-score -4 -3 -2 -1 0 1 2 3 4 • What percentage of scores are contained between 96 and 160? • What percentage of scores are between 128 and 160? • If I have a total of 200 scores, how many of them are less than 128?
m= 128 s = 32 What proportion of people got a z score of 1.5 or higher? But how do we find areas associated with z-scores that are not simply 0, 1, or 2? Table A in appendix D contains the areas under the normal curve indexed by Z-score. Z-score -4 -3 -2 -1 0 1 2 3 4 From these tables you can determine the number of individuals on either side of any z-score.
1.5 z-score
Examples of AREA C 2.3 -1.7
What percentage of people have a z-score of 0 or greater? 50% What percentage of people have a z-score of 1 or greater? 15.87% What percentage of people have a z-score of -2.5 or less? .62% What percentage of people have a z-score of 2.3 or greater? 1.07% What percentage of people have a z-score of -1.7 or less? 4.46%
What percentage of people have a z-score between 0 and 1? 34.13% What percentage of people have a z-score between 0 and 2.3? 48.93% What percentage of people have a z-score between 0 and -2.4? 49.18% What percentage of people have a z-score between 0 and 1.27? 39.80% What percentage of people have a z-score between 0 and 1.79? 46.33% What percentage of people have a z-score between 0 and -3.24? 49.94%
Areas which require a COMBINATION of z-scores What percentage of people have a z-score of 1 or less? 84.13%
Areas which require a COMBINATION of z-scores What percentage of people have a z-score between -1 and 2.3? 84.13%
Areas which require a COMBINATION of z-scores What percentage of people have a z-score of 1 or less? 84.13%
Areas which require a COMBINATION of z-scores What percentage of people have a z-score of 1 or less? 84.13%
Areas which require a COMBINATION of z-scores What percentage of people have a z-score of 1 or less? 84.13%
Areas which require a COMBINATION of z-scores What percentage of people have a z-score of 1 or less? 84.13%
m= 128 s = 32 Raw Score 0 32 64 96 128 160 192 224 256 What percentage of people have a z-score of -1.7 or less? 4.46% What percentage of people have a score of 73.6 or less? 4.46%? What z-score is required for someone to be in the bottom 4.46%? -1.7 What score is required for someone to be in the bottom 4.46%? 128 + (-1.7)32 128 - 54.4 73.6 or below
What z-score is required for someone to be in the top 25%? .68 What z-score is required for someone to be in the top 5%? 1.65 What z-score is required for someone to be in the bottom 10%? -1.29 What z-score is required for someone to be in the bottom 70%? .52 What z-score is required for someone to be in the top 50%? 0 What z-score is required for someone to be in the bottom 30%? -.53
m= 128 s = 32 What percentage of scores fall between the mean and a score of 132? Here, we must first convert this raw score to a z-score in order to be able to use what we know about the normal distribution. (132-128)/32 = 0.125, or rounded, 0.13. Area B in the z-table indicates that the area contained between the mean and a z-score of .13 is .0517, which is 5.17%
m= 128 s = 32 What percentage of scores fall between a z-score of -1 and 1.5? If we refer to the illustration above, it will require two separate areas added together in order to obtain the total area: Area B for a z-score of -1: .3413 Area B for a z-score of 1.5: .4332 Added together, we get .7745, or 77.45%
m= 128 s = 32 What percentage of scores fall between a z-score of 1.2 and 2.4? Notice that this area is not directly defined in the z-table. Again, we must use two different areas to come up with the area we need. This time, however, we will use subtraction. Area B for a z-score of 2.4: .4918 Area B for a z-score of 1.2: .3849 When we subtract, we get .1069, which is 10.69%
m= 128 s = 32 If my population has 200 people in it, how many people have an IQ below a 65? First, we must convert 65 into a z-score: (65-128)/32 = -1.96875, rounded = -1.97 Since we want the proportion BELOW -1.97, we are looking for Area C of a z-score of 1.97 (remember, the distribution is symmetrical!) : .0244 = 2.44% Last step: What is 2.44% of 200? 200(.0244) = 4.88
m= 128 s = 32 What IQ score would I need to have in order to make it to the top 5%? Since we’re interested in the ‘top’ or the high end of the distribution, we want to find an Area C that is closest to .0500, then find the z-score associated with it. The closest we can come is .0495 (always better to go under). The z-score associated with this area is 1.65. Let’s turn this z-score into a raw score: 128 + 1.65(32) = 180.8
A possible type of test question: 80 - 65 A class of 30 students takes a difficult statistics exam. The average grade turns out to be 65. Michael is a student in this class. His grade on the exam is 80. The following is known: 9.80 SS = 2883.2 Assuming that these 30 students make up the population of interest, what is the approximate number of people that did better than Michael on the exam? SS= 2883.2 2883.2 30 SS N m = 65 √ √ N = 30 s = =√96.11 = 9.80 = z(80) = (80-65)/9.80 = 1.53 Area C for a z score of 1.53 = .0630, so about 6.3%, or 1.89 people, about 2.