Download
1 / 26
260 likes | 317 Vues
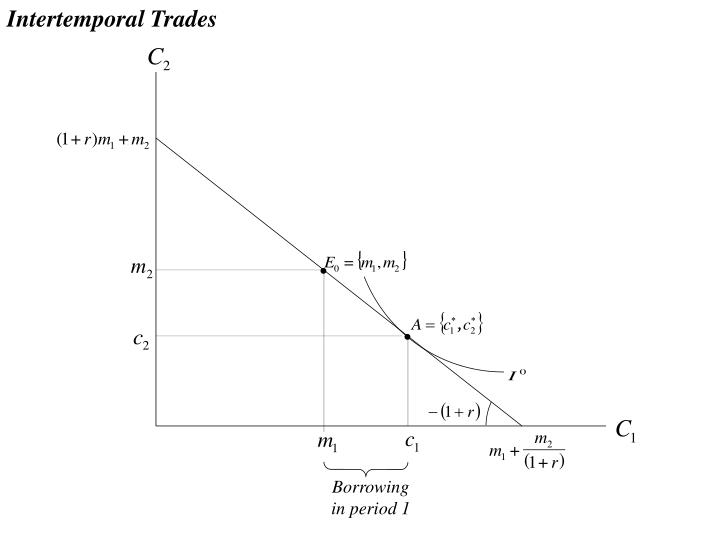
Intertemporal Trades. •. •. Borrowing in period 1. Intertemporal Trades. Patient preferences. Impatient preferences. Optimal Holding Period for an Asset. FV( t ) = 100 + 6 t + 2 t 2 – 0.1 t 3. Rate of return from holding asset. t*. Asset Markets: Debt. Asset Markets: Debt.

E N D
Intertemporal Trades • • Borrowing in period 1
Intertemporal Trades Patient preferences Impatient preferences
Optimal Holding Period for an Asset FV(t) = 100 + 6t + 2t2 – 0.1t3 Rate of return from holding asset t*
Risky Assets: Equities S&P 500 2007 Return: 3.67% Volatility: 16.02% 2008 Return: - 38.52% Volatility: 41.10% 2009 Return: 23.44% Volatility: 27.27%
Risky Assets: Portfolios S&P 500 and Malkiel Portfolio 2007 Return: 3.67% Volatility: 16.02% Return: 17.92% Volatility: 18.05% 2008 Return: - 38.52% Volatility: 41.10% Return: - 35.97% Volatility: 33.14% 2009 Return: 23.44% Volatility: 27.27% Return: 37.35% Volatility: 20.81%
Capital Asset Pricing Model Capital Market Line Security Market Line 1
Capital Asset Pricing Model ri = 3 + 5bi
Efficient Market Hypothesis A theory that asset prices reflect all publicly available information about the value of an asset. Strong Form: Asset prices reflect all information, public and private, and no one can earn excess returns Semi-Strong Form: Asset prices adjust very rapidly to publicly available new information and in an unbiased fashion, such that no excess returns can be earned by trading on that information. Semi-strong-form efficiency implies that neither fundamental analysis nor technical analysis will be able to reliably produce excess returns. Weak Form: Future asset prices cannot be predicted by analyzing price from the past. Excess returns can not be earned in the long run by using investment strategies based on historical share prices or other historical data.
Diversification and Portfolio Theory Expected Return of a Portfolio (2 investments): E[rx]= x1E[r1] + x2E[r2] (x1 + x2 = 1) Expected Variance of a Portfolio (2 investments): s1,22 = x12s12 + x22s22 + 2x1x2s1,2 = x12s12 + x22s22 + 2x1x2r1,2s1s2
Diversification and Portfolio Theory Portfolio Example Weights: E[rx]= x1E[r1] + x2E[r2] s1,22 = x12s12 + x22s22 + 2x1x2s1,2 = x12s12 + x22s22 + 2x1x2r1,2s1s2
What does a negative beta asset look like? Was the yen a negative beta asset in 2007 – 2008? The blue line is FXY, an exchange-traded fund that tracks the yen. The red line is the S&P 500 index. Over the past year, the two time-series look like mirror images of each other. That is, holding yen seems to hedge U.S. stock-market risk. Source: http://gregmankiw.blogspot.com/ 29 May 2008
What does a negative beta asset look like? Was the yen a negative beta asset in 2007 – 2008?
What does a negative beta asset look like? Was the yen a negative beta asset in 2007 – 2008?
Dealing With Risk: Diversification (Portfolio Theory) Effect of Additional Investments / Assets on Diversification
Risk and Uncertainty: “Contingent Consumption Plans” Case 2: A person with an endowment of $35,000 faces a 1% probability of losing $10,000. He is considering the purchase of full insurance against the loss for $100. Case 1: A person with an endowment of $100 is considering the purchase of a lottery ticket that costs $5. The winning ticket in the lottery gets $200. 40 tickets will be sold. $100 $35,000 Lucky day Outcome A: Do not purchase Do not purchase Unlucky day $25,000 Lucky day Lucky day $295 $34,900 Pr(Lucky) = 0.025): Purchase Purchase Outcome B: Unlucky day Unlucky day $95 $34,900
Risk and Uncertainty: “Contingent Consumption Plans” $35,000 Lucky day Do not purchase Unlucky day $25,000 Lucky day $34,900 • Purchase Unlucky day $34,900 • K = the “expected loss” ($10,000), and gK is the insurance premium.
Defining Risk Aversion 1. Risk aversion is defined through peoples’ choices: 2. Non-linearity in the utility of wealth. Given a choice between two options with equal expected values and different standard deviations, a risk averse person will choose the option with the lower standard deviation: Given a choice between two options with equal standard deviations and different expected values, a risk-averse person will choose the option with the higher expected value:
Risk Aversion and the Marginal Utility of Money Utility A U($) U3 l U2 l l B D Risk Premium U1 l C Risk Premium $ $0 $99,415 $99,500 $100,000 $50,000
Modeling Different Risk Preferences U($) U($) Utility U($) Risk Aversion Risk Neutral Risk Seeking $
Classification of Auctions What is the nature of the good being auctioned? What are the bidding rules? • English ascending bid • Private values • Dutch descending bid • Common value • Sealed bid • Vickrey second price
Evaluative Criteria for Auctions Pareto Efficiency Does the auction design guarantee that the item will go to the bidder with the highest value? Revenue or Profit Maximization Does the auction design guarantee the highest revenue (or profit) for the seller?
Types of Auctions and optimal bidding strategies Independent Private Values Auctions Each bidder knows precisely how highly he/she values the item, and these values vary across all bidders. • English (ascending bid) • Dutch (descending bid) • First-price, sealed bid • Second-price, sealed bid
Types of Auctions and optimal bidding strategies Common (or Correlated) Values Auctions The item being bid has an underlying objective value, but no bidder knows precisely what that value is. • Winning bids tend to come from those with the most optimistic estimates. • If estimate errors are randomly distributed around zero, then the winning bid will be greater than the true value of the item (the “winner’s curse”): Distribution of bids: Winning Bid True Value