Download
1 / 53
530 likes | 684 Vues
Pathways, Networks and Systems Biology OR “what do I do with my gene list?” BMI 705. Kun Huang Department of Biomedical Informatics Ohio State University. Gene Enrichment Analysis Gene Ontology / Pathways / Networks Databases and Resources Gene Regulation (cis-)Networks

E N D
Pathways, Networks and Systems BiologyOR “what do I do with my gene list?”BMI 705 Kun Huang Department of Biomedical Informatics Ohio State University
Gene Enrichment Analysis • Gene Ontology / Pathways / Networks • Databases and Resources • Gene Regulation (cis-)Networks • Challenges in system biology • New computation and modeling methods • Kinetics vs. dynamics • Scale-Free Network and Network Motifs
Where do I get the gene list? • Comparative study • e.g., microarray experiments between two types of samples or two disease states (can also be from RT-PCA, proteomics, …) • Clustering / classification of genes • e.g., co-expressed genes • Homologue analysis • e.g., genes from BLAST • Other sources
What do I do with the gene list? • Find commonality among the gene • Common biological functions • Common molecular processes • Common cellular components • Common pathways • Interact with common genes • Common sequences / molecular structures • Regulated by common Transcription Factors • Involved in the same disease • … • Generate new hypothesis based on the commonality
How do I find commonality from my gene list? • Using a priori knowledge (e.g., gene ontology, pathway, annotation, etc.) • Fisher’s exact test (chi-square based) • Other statistical method • Good news – most of the time you can use software to do it How significant is the intersection?
What softwares are available? • Many • DAVID (http://david.abcc.ncifcrf.gov/) • Cytoscape • GOTerm • BiNGO • GSEA • GenMapp (Free) • Pathway Architect (Commercial) • Pathway Studio (Commercial) • Ingenuity Pathway Analysis (Commercial) • Manually curated • On-demand computation
Gene Enrichment Analysis • Gene Ontology / Pathways / Networks • Databases and Resources • Gene Regulation (cis-)Networks • Challenges in system biology • New computation and modeling methods • Kinetics vs. dynamics • Scale-Free Network and Network Motifs
Transcription in higher eukaryotes • Gene Expression • Chromatin structure • Initiation of transcription • Processing of transcripts • Transport to cytoplasm • mRNA translation • mRNA stability • Protein activity stability distal promoter region proximal promoter region TFBS: Transcription Factor Binding Sites Adapted from Wesserman & Sandelin, 2004, Nature Rev. Genetics
Characterization of transcriptional regulation • Annotating regulatory regions (TSS and Promoter) • Identifying cis-regulatory modules • Deciphering logic of regulatory networks
Transcriptional regulatory module • cis-regulatory elements are sequence-specific regions transcription factors bind CGGTTAAG GCTAACGC AGGCTA CGGTTAAG • TFs combinatorially associate with each other to form modules and regulate their target genes GCTAACGC AGGCTA
Identify Cis-Regulatory Element • TFs bind to cis-acting regulator elements (CAREs). • CAREs are DNA motifs of length 5 – 20 (e.g., 5’ CGGnnnnnnnnnnnCCG 3’, the binding site for yeast TF, Gal4). • Most CAREs are in the 5’ vicinity of the gene (promoter), but some have been identified downstream. • Algorithms focus on identify common motifs. • Words count. • Probabilistic methods (weight matrix, combined with EM search). • Phylogenetic footprinting. • Other features: CpG island.
Example – from JASPAR Database • AGL3 A [ 0 3 79 40 66 48 65 11 65 0 ] C [94 75 4 3 1 2 5 2 3 3 ] G [ 1 0 3 4 1 0 5 3 28 88 ] T [ 2 19 11 50 29 47 22 81 1 6 ]
Example Workflow Gene list Extract promoter sequences Multiple sequence alignment Ab Initio Motifs Discovery Programs (Weeder and MEME) Manual selection i candidate Motifs Screen against TRANSFAC n final known and novel Motifs Question : How do you extract upstream sequences for genes?
ChIPMotifs (from Dr. Victor Jin) k Top Level Sequences Ab Initio Motifs Discovery Programs (Weeder and MEME) i candidate Motifs Bootstrap re-sampling approachto determine optimal cutoff of Motifs and screen against non-enrichment sequences k>i>m>n m final statistical significant candidate Motifs Screen against TRANSFAC n final known and novel Motifs Question : How do you extract upstream sequences for genes?
Gene Enrichment Analysis • Gene Ontology / Pathways / Networks • Databases and Resources • Gene Regulation (cis-)Networks • Challenges in system biology • New computation and modeling methods • Kinetics vs. dynamics • Scale-Free Network and Network Motifs
Understanding! • System Sciences • Theory • Analysis • Modeling • Synthesis/prediction • Simulation • Hypothesis generation Prediction! System Biology • Biology • Domain knowledge • Hypothesis testing • Experimental work • Genetic manipulation • Quantitative measurement • Validation • Informatics • Data management • Database • Computational infrastructure • Modeling tools • High performance computing • Visualization
“A key element of the GTL program is an integrated computing and technology infrastructure, which is essential for timely and affordable progress in research and in the development of biotechnological solutions. In fact, the new era of biology is as much about computing as it is about biology. Because of this synergism, GTL is a partnership between our two offices within DOE’s Office of Science—the Offices of Biological and Environmental Research and Advanced Scientific Computing Research. Only with sophisticated computational power and information management can we apply new technologies and the wealth of emerging data to a comprehensive analysis of the intricacies and interactions that underlie biology. Genome sequences furnish the blueprints,technologies can produce the data, and computing can relate enormous data sets to models linking genome sequence to biological processes and function.”
Taniguchi et al.Nature Reviews Molecular Cell Biology7, 85–96 (February 2006) | doi:10.1038/nrm1837
Challenges in system biology • Large data • Kinetics vs. dynamics • Multiple (temporal) scale • New computation and modeling methods • New mathematics or new physics laws
Oscillation A B Maeda et al., Science, 304(5672):875-878, 2004
Simple Two Nodes Pattern Chang et al., Multistable and multistep dynamics in neutrophil differentiation, BMC Cell Biology 2006, 7:11 Bistable dynamics in a two-gene system with cross-regulation. A. Gene regulatory circuit diagram. Blunt arrows indicate mutual inhibition of genes X and Y. Dashed arrows indicate a basal synthesis (affected by the inhibition) and an independent first-order degradation of the factors. B. Two-dimensional XY phase plane representing the typical dynamics of the circuit. Every point (X, Y) represents a momentary state defined by the values of the pair X, Y. Red arrows are gradient vectors indicating the direction and extent that the system will move to within a unit time at each of the (X, Y) positions. Collectively, the vector field gives rise to a "potential landscape", visualized by the colored contour lines (numerical approximation). In this "epigenetic landscape", the stable states (attractors) are in the lowest points in the valleys: a (X>>Y) and b (Y>>X) (gray dots). C. Schematic representation of the epigenetic landscape as a section through a and b in which every red dot represents a cell. Experimentally, this bistability is manifested as a bimodal distribution in flow cytometry histograms in which the stable states a and b appear as peaks at the respective level of marker expression (e.g., Y).
New system biology • Kinetics vs. Dynamics • Compartmentalization (Spatial and Temporal) • Hybrid Systems and System Abstraction • Hierarchical/multiscale description • Discrete Event System • New System Theory • Graph Theory and Network Theory / New Mathematics and New Physics
Gene Enrichment Analysis • Gene Ontology / Pathways / Networks • Databases and Resources • Gene Regulation (cis-)Networks • Challenges in system biology • New computation and modeling methods • Kinetics vs. dynamics • Scale-Free Network and Network Motifs
A Tale of Two Groups A.-L. Barabasi at University of Notre Dame Ten Most Cited Publications: • Albert-László Barabási and Réka Albert, Emergence of scaling in random networks , Science 286, 509-512 (1999). [ PDF ] [ cond-mat/9910332 ] • Réka Albert and Albert-László Barabási, Statistical mechanics of complex networks Review of Modern Physics 74, 47-97 (2002). [ PDF ] [cond-mat/0106096 ] • H. Jeong, B. Tombor, R. Albert, Z.N. Oltvai, and A.-L. Barabási, The large-scale organization of metabolic networks, Nature 407, 651-654 (2000). [ PDF ] [ cond-mat/0010278 ] • R. Albert, H. Jeong, and A.-L. Barabási, Error and attack tolerance in complex networksNature 406 , 378 (2000). [ PDF ] [ cond-mat/0008064 ] • R. Albert, H. Jeong, and A.-L. Barabási, Diameter of the World Wide Web Nature 401, 130-131 (1999). [ PDF ] [ cond-mat/9907038 ] • H. Jeong, S. Mason, A.-L. Barabási and Zoltan N. Oltvai, Lethality and centrality in protein networksNature 411, 41-42 (2001). [ PDF ] [ Supplementary Materials 1, 2 ] • E. Ravasz, A. L. Somera, D. A. Mongru, Z. N. Oltvai, and A.-L. Barabási, Hierarchical organization of modularity in metabolic networks, Science 297, 1551-1555 (2002). [ PDF ] [ cond-mat/0209244 ] [ Supplementary Material ] • A.-L. Barabási, R. Albert, and H. Jeong, Mean-field theory for scale-free random networks Physica A 272, 173-187 (1999). [ PDF ] [ cond-mat/9907068 ] • Réka Albert and Albert-László Barabási, Topology of evolving networks: Local events and universality Physical Review Letters 85, 5234 (2000). [ PDF ] [ cond-mat/0005085 ] • Albert-László Barabási and Zoltán N. Oltvai, Network Biology: Understanding the cells's functional organization, Nature Reviews Genetics 5, 101-113 (2004). [ PDF ]
A Tale of Two Groups Uri Alon at Weissman Institute Selected Publications: R Milo, S Itzkovitz, N Kashtan, R Levitt, S Shen-Orr, I Ayzenshtat, M Sheffer & U Alon, Superfamilies of designed and evolved networks, Science, 303:1538-42 (2004). Pdf. R Milo, S Shen-Orr, S Itzkovitz, N Kashtan, D Chklovskii & U Alon, Network Motifs: Simple Building Blocks of Complex Networks, Science, 298:824-827 (2002). Pdf. S Shen-Orr, R Milo, S Mangan & U Alon, Network motifs in the transcriptional regulation network of Escherichia coli. Nature Genetics, 31:64-68 (2002). Pdf. S. Mangan, S. Itzkovitz, A. Zaslaver and U. Alon, The Incoherent Feed-forward Loop Accelerates the Response-time of the gal System of Escherichia coli. JMB, Vol 356 pp 1073-81 (2006). Pdf. S Mangan & U Alon, Structure and function of the feed-forward loop network motif. PNAS, 100:11980-11985 (2003). Pdf. S. Mangan, A. Zaslaver and U. Alon, The Coherent Feedforward Loop Serves as a Sign-sensitive Delay Element in Transcription Networks. JMB, Vol 334/2 pp 197-204 (2003). Pdf. Guy Shinar, Erez Dekel, Tsvi Tlusty & Uri Alon, Rules for biological regulation based on error minimization, PNSA. 103(11), 3999-4004 (2006). Pdf. Alon Zaslaver, Avi E Mayo, Revital Rosenberg, Pnina Bashkin, Hila Sberro, Miri Tsalyuk, Michael G Surette & Uri Alon, Just-in-time transcription program in metabolic pathways, Nature Genetics 36, 486 - 491 (2004). Pdf. U. Alon, M.G. Surette, N. Barkai, S. Leibler, Robustness in Bacterial Chemotaxis, Nature 397,168-171 (1999). Pdf M Ronen, R Rosenberg, B Shraiman & U Alon, Assigning numbers to the arrows: Parameterizing a gene regulation network by using accurate expression kinetics. PNAS, 99:10555–10560 (2002). Pdf. N Rosenfeld, M Elowitz & U Alon, Negative Autoregulation Speeds the Response Times of Transcription Networks, JMB, 323:785-793 (2002). Pdf. N Rosenfeld & U Alon, Response Delays and the Structure of Transcription Networks, JMB, 329:645–654 (2003). Pdf. S. Kalir, J. McClure, K. Pabbaraju, C. Southward, M. Ronen, S. Leibler, M.G. Surette, U. Alon, Ordering genes in a flagella pathway by analysis of expression kinetics from living bacteria. Science, 292:2080-2083 (2001). Pdf Y. Setty, A. E. Mayo, M. G. Surette, and U. Alon, Detailed map of a cis-regulatory input function, PNAS, 100:7702-7707 (2003). Pdf. Shiraz Kalir and Uri Alon, Using a Quantitative Blueprint to Reprogram the Dynamics of the Flagella Gene Network, Cell, 117:713–720, (2004). Pdf.
Expected P(k) ~ k- Found Small world phenomena (http://smallworld.columbia.edu) R. Albert, H. Jeong, A-L Barabasi, Nature, 401 130 (1999).
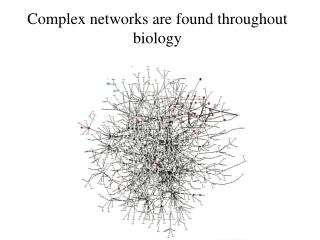
Other Observations: • Scientific citations • Paper coauthorship/collaboration • Organization structure • Social structure • Actor joint casting in movies • Online communities • Websites linkage • … • Protein networks • Gene networks • Cell function networks • …
Archaea Bacteria Eukaryotes Metabolic network H. Jeong, B. Tombor, R. Albert, Z.N. Oltvai, and A.L. Barabasi, Nature, 407 651 (2000) Organisms from all three domains of life are scale-free networks!
Power Law Small World Rich Get Richer (preferential attachment) Self-similarity HUBS!
Preferential attachment in protein Interaction networks k vs. k : increase in the No. of links in a unit time No PA:k is independent of k PA:k ~k Eisenberg E, Levanon EY, Phys. Rev. Lett. 2003 Jeong, Neda, A.-L.B, Europhys. Lett. 2003
Nature Biotechnology 18, 1257 - 1261 (2000) doi:10.1038/82360 A network of protein−protein interactions in yeast Benno Schwikowski, Peter Uetz & Stanley Fields
Nature Biotechnology 18, 1257 - 1261 (2000) doi:10.1038/82360 A network of protein−protein interactions in yeast Benno Schwikowski, Peter Uetz & Stanley Fields
C. Elegans Drosophila M. Giot et al. Science 2003 Li et al. Science 2004
Consequence 1 : Hubs and Robustness Nature 408 307 (2000) … “One way to understand the p53 network is to compare it to the Internet. The cell, like the Internet, appears to be a ‘scale-free network’.”
Consequence 1 : Hubs and Robustness 1 node failure S fc 0 1 Fraction of removed nodes, f Complex systems maintain their basic functions even under errors and failures (cell mutations; Internet router breakdowns)
Hubs and Robustness Complex systems maintain their basic functions even under errors and failures (cell mutations; Internet router breakdowns) R. Albert, H. Jeong, A.L. Barabasi, Nature 406 378 (2000)
Achilles’ Heel of complex networks Internet failure attack R. Albert, H. Jeong, A.L. Barabasi, Nature 406 378 (2000)
Yeast protein network - lethality and topological position Highly connected proteins are more essential (lethal)... H. Jeong, S.P. Mason, A.-L. Barabasi, Z.N. Oltvai, Nature 411, 41-42 (2001)