Download
1 / 47
470 likes | 580 Vues
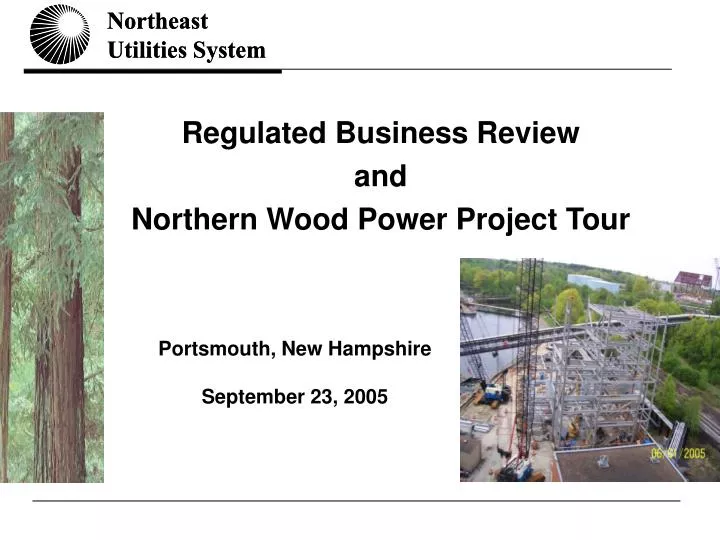
Northeast Utilities System. Regulated Business Review and Northern Wood Power Project Tour. Portsmouth, New Hampshire September 23, 2005. Safe Harbor Provisions.

E N D
Northeast Utilities System Regulated Business Review and Northern Wood Power Project Tour Portsmouth, New Hampshire September 23, 2005
Safe Harbor Provisions This presentation contains statements concerning NU’s expectations, plans, objectives, future financial performance and other statements that are not historical facts. These statements are “forward-looking statements” within the meaning of the Private Securities Litigation Reform Act of 1995. In some cases, a listener can identify these forward-looking statements by words such as “estimate”, “expect”, “anticipate”, “intend”, “plan”, “believe”, “forecast”, “should”, “could”, and similar expressions. Forward-looking statements involve risks and uncertainties that may cause actual results or outcomes to differ materially from those included in the forward-looking statements. Factors that may cause actual results to differ materially from those included in the forward-looking statements include, but are not limited to, actions by state and federal regulatory bodies; competition and industry restructuring; changes in economic conditions; changes in weather patterns; changes in laws, regulations or regulatory policy; expiration or initiation of significant energy supply contracts; changes in levels of capital expenditures; developments in legal or public policy doctrines; technological developments; volatility in electric and natural gas commodity markets; effectiveness of our risk management policies and procedures; changes in accounting standards and financial reporting regulations; fluctuations in the value of electricity positions; obtaining new contracts at anticipated volumes and margins; terrorist attacks on domestic energy facilities; and other presently unknown or unforeseen factors. Other risk factors are detailed from time to time in our reports to the Securities and Exchange Commission. We undertake no obligation to update the information contained in any forward-looking statements to reflect developments or circumstances occurring after the statement is made.
Topics for the Morning • Regulated distribution business overview in Connecticut and Massachusetts • PSNH and New Hampshire overview • New Hampshire generation and Northern Wood Project • NU transmission investment update
Overview of Connecticut and Massachusetts Delivery Businesses Cheryl Grise’ President – Utility Group
Overview of Regulated Businesses In millions of dollars Numbers of customers in thousands as of 6/30/05 * * *Excludes acquisition premium
CL&P Distribution: Critical Success Factors • Timely recovery of flow-through costs • Transitional standard offer (TSO) payments • Reliability-must-run payments • Transmission costs • Stranded costs (RRB) • Distribution rates that provide timely recovery of and/or return on: • Increasing capital investments ($225 million of annual cap ex vs. $125 million of depreciation) • Rising pension, health benefit costs • Other operating costs • Strong customer service, reliability • Modest retail sales growth
CL&P Bill Components Today The proposed transmission investments in CT will help contain generation, congestion, and RMR costs. cents/kwh
New Connecticut Legislation Provides Opportunities, Some Challenges for CL&P • Incentives provide new earnings opportunities for capacity built in CL&P service area • $25/kw for new traditional capacity • $200/kw for distributed generation • CL&P could build its own generation, but it could be obligated to sell the capacity after five years • Future of TSO procurement fee unclear after 2006 • Begun in 2004 • Currently provides about $7 million of annual net income • 0.5 mills/kwh is being collected now • 0.25 mills/kwh additional incentive under review • DPUC report back to legislature in early 2006 on procurement fee future • Transmission tracker ensures timely recovery of rising transmission costs
Yankee Gas Growth Opportunities Focused on Infrastructure Investments • LNG facility • New line to New England Gas in Rhode Island through southeast Connecticut entered service in 11/04 • Support for construction of new generating capacity • Considerable interest expressed to date • $15 million of investment annually to improve reliability • $15 million annually to meet load growth • $15 million on meters, technology, highway relocations, other commitments
Yankee Gas LNG Project • 1.2 Bcf LNG storage tank • Vaporization capability of 60,000 mcf per day • Liquefaction capability of 6,000 mcf per day • Total costs estimated at $108 million • Incremental capacity to fill supply gap • Construction 35% complete • Scheduled to be in service for the 2007/2008 winter heating season • Will help insulate customers from price volatility
Status of Yankee Rates • $14 million distribution rate increase effective 1/1/05 • Next rate case expected to be filed in late 2006 to be effective 7/1/07 or when LNG facility enters service, whichever is sooner • Full pass-through of purchased gas costs
WMECO Remains Quiet on Regulatory Front • $6 million distribution rate increase 1/1/05 has allowed earnings to stabilize • $3 million distribution rate increase approved for 1/1/06 • Rate case will be filed around 7/1/06 to be effective 1/1/07 • Capital investment smaller than other subsidiaries, but still twice depreciation • $40 million for T&D in 2005 • Full and timely pass-through of purchased power costs
We Are Closely Watching Retail Electric Sales YTD sales through August (2005 vs. 2004) (percent increase/decrease) Actual Electric Sales Weather-Adjusted Electric Sales Residential Commercial Industrial Total Retail Electric
PSNH Overview Gary Long President and Chief Operating Officer
PSNH Service Area: Key Facts • 5,445 square miles • 211 New Hampshire communities • More than 480,000 customers • 8,041,000 megawatt hours in annual sales • 1,234 employees • 1,000 miles of transmission and about 12,000 miles of distribution lines
Major NH Electric Restructuring Timeline 2000: Electric restructuring laws approved by the NH Legislature consistent with a 1999 state settlement agreement with PSNH 2002: Electric restructuring laws modified to restrict PSNH from divesting its generating units until at least 2004 2003: Electric restructuring laws modified again to restrict PSNH from divesting its generating units until at least April 30, 2006. PSNH to divest its generation only if it is in the economic interest of PSNH’s retail customers The changes allowed PSNH to modify its generation facilities with cost recovery thus enabling the NWPP
PSNH Regulatory Rate Settlement of 2004 • T&D rate increases of $3.5 million on 10/1/04 and $10 million on 6/1/05 • Partially for the purpose of recovering costs due to the transfer of 34.5kv system assets from transmission to distribution rate base • Commitment to invest at least $60 million in capital improvements to its electric system in 2005 • No specified ROE • No requirement or restrictions on a filing date for a new rate case • The revenue requirements associated with the Northern Wood Power Project are recovered fully through reconciled energy service prices, subject to a NWPP “Risk Sharing Agreement”
Other Key PSNH Regulatory Items • Generation ROE • NHPUC lowered ROE on PSNH generation equity from 11% to 9.63%, effective 7/1/05 • Affects about $100 million of equity • PSNH’s request for reconsideration is pending before the NHPUC • Fully tracking energy charge • Set once a year with the option of a mid-year change if needed • Recovers actual purchased power and fuel costs • Recovers all costs related to generationincluding a return on investment
PSNH Retail Rates Today cents/kwh 0.055 September 2005 Total 13.855 cents/kwh
New Hampshire Economy Remains Strong Employment Growth (% change 7/05 vs. 7/04) Manufacturing Employment Growth (% change 7/05 vs. 7/04) Unemployment Rate (July 2005) New Hampshire New England U.S.
PSNH Generation John MacDonald Vice President - Operations
PSNH Generation in 2004 Meeting Customer Demand PSNH-Owned Generation 70%PSNH-Owned Generation Purchases 30% Purchases Purchases
PSNH Generation Fleet is Competitive cents/kwh 8.50¢ 7.24¢ $75 Million in Savings Annually * Forecast estimate
Schiller Station: Future Site Plan Northern Wood Power Project
Sources of Wood for the Northern Wood Power Project Fuel will be delivered by truck
New Hampshire is a Small, Heavily Forested State • Covers 5.7 million acres, with about 1.3 million residents • Second most forested state in the nation (80%) • Home to one of the oldest private forest conservation organizations in the country (Society for the Protection of NH Forests: 1901) • Forest products industry in NH is a major employer and economic force • Forestry represents $3.9 billion in economic activity statewide, roughly 11% of the gross state product
The Wood-Chip Market in NH Peaked at About 1.8 Million Tons Annually in 1992 Tons Peak Wood-fired IPP Buyouts Start
The Economics of the Project Are Strong • Capital Cost of the Project • Estimated total cost $75 million • Purchase and install new boiler, stack, environmental and fuel equipment • Balance of plant/civil addition/modifications • Engineering, permitting, and construction and AFUDC • Operating Cost of the Station • $300,000 projected increase annually • Variable Fuel Costs • Coal on existing boiler $28-32/mwhr • Wood on new boiler $32-38/mwhr Additional Revenue and Avoided Cost Associated with the Project Sale of additional incremental generation: $2-3M/year Reduced emissions cost: $3-5M/year Sale of renewable energy credits: $8-12M/year Production tax credit: $3M/year
Environmental Benefits Using wood for fuel has significant environmental benefits
The NWPP Leverages an Emerging Market for “Green Power” in the Region REC’s
NWPP Regulatory Treatment Equity: $33.75M (45%) Allowed return: 9.63% Earnings: $3.25M/year Total Investment $75 Million Debt: $41.25M 55% 50/50 sharing of supplemental revenues and rebates over or below settlement baseline* * Includes revenue from the sale of Renewable Energy Certificates or Renewable Production Tax Credits
The Technology Planned for the Project Boosts the Environmental Benefits • A circulating fluidized bed (CFB) type boiler will be installed at Schiller Station to replace an existing boiler • Known and proven technology • Significantly lowers emissions • Provides for fuel flexibility • Qualifies for the renewable portfolio standard (RPS) in Massachusetts and Connecticut
Northeast Utilities Plans for Investment in Transmission Infrastructure Lee Olivier President – Transmission Group
: Constraint and constrained flow direction The Nation’s Transmission System is in Need of Significant Additions and Upgrades FERC’s Electric Transmission Constraint Study identified congestion points that need immediate relief. • A 2001 Edison Electric Industry (EEI) study identified $56B in transmission infrastructure investment needs. • The Federal Energy Regulatory Commission (FERC) has identified $12B that is needed simply to relieve immediate congestion points. • The August 14, 2003 blackout report addresses the need for significant new transmission investments. Transmission Constraints in the Contiguous U.S. Pacific DC Intertie ISO-NE Northeast of Boston NWPA MAPP CA/OR Interface NYISO WY/ID Interface Southwest MI East NY Central IA SW CT Interface PJM ECAR West VA/PJM Interface Southeast PA East KS/MO Interface MAIN RMPA CA/MX Central CA SPP Central MO Southeast West VA Northeast AZ Southern CA AZ/NM/SNV SERC FRCC 37
About Northeast Utilities Transmission… • Comparative Ranking of NU at 12/31/04 • (Of the 20 largest transmission companies in the 11 Northeastern States) • 4th Largest in terms of miles • 10th largest in terms of Net Transmission Assets
In New England, the Regional Transmission Expansion Plan (RTEP) Identifies Nearly $2.4 Billion in Projects NU’s part of that transmission expansion program is over $1.4 billion.
Transmission Investment has a Favorable Regulatory and Financial Environment • NU’s transmission tariffs fully track all transmission costs; • Rates are forward looking, based upon forecasted investment level • Rates are adjusted every six months • Provide for recovery of allowed cost of equity • Rates are trued-up annually • The combination of forward looking rates and the annual true-up provision lower the risks associated with recovery of transmission investment. • ROEs granted by FERC are more robust than those being granted by retail commissions, and reflect FERC’s policy of providing incentives for transmission investment. • NU has put in place other initiative to manage risks • Internal organizational realignment with new transmission officers that have experience with large capital projects in both nuclear and T&D • Enlisting top external engineering firms as agents on large projects providing engineering, procurement and construction management • Conducting competitive bids on large components of all major projects • Implemented a risk management process with help from an external consultant on all major projects
Transmission Group Asset Strategy for 2005 • NU expects to spend $245 million for its transmission capital program for 2005 • Five large projects in Connecticut comprise over two-thirds of the capital program: • Bethel-Norwalk $121.9M • Middletown-Norwalk $18.0M • Glenbrook Cables $3.9M • Long Island Replacement Cable $8.3M • Haddam Autotransformer $14.0M • The remaining one-third is comprised of nearly 200 projects in Transmission’s three-state region: • Connecticut $42.5M • Massachusetts $12.5M • New Hampshire $23.9M $166.1M $78.9M
White Mountain Upgrade Madbury Capacitor Tioga Gosling Road Substation Fitzwilliam Substation Scobie Substation Hudson – Scobie Line Berkshire Solution Pleasant Capacitor Springfield Solution Woodland Capacitor Southern New England Reliability Project (SNERP) Barbour Hill Autotransformer Northeastern Connecticut Bethel - Norwalk Plumtree - Triangle Haddam Autotransformer Middletown - Norwalk Long Island Replacement Cable (LIRC) Glenbrook Cables NU’s Transmission Asset Strategy Has Identified Both Current and Future Transmission Investments • NU’s Transmission Asset Strategy has identified the need for significant capital investment on franchise in all three states • Transmission interconnections and interstate seams issues will become regional planning initiatives • Technological advancement will create additional opportunities to invest Legend Under Construction Siting Approved Future Project
The Need: An Adequate Transmission System SWCT improvements have been a top priority in each of ISO-NE’s last four regional transmission expansion plans. Our four major projects there total over $1.3 billion in investment. Bethel-Norwalk 345 kV Underground & Overhead $300-350 Million • 21 miles 345kV (56% underground) • 10 miles 115kV (100% underground) • Projected in-service date: Dec 2006 50% of CT Load Middletown-Norwalk 345 kV Underground & Overhead $672-792 Million* (CL&P 80% Share) 345-kV 115-kV Glenbrook Cables 115 kV Underground $120 Million • 69 miles 345kV (35% underground) • 57 miles 115kV (1% underground) • Projected in-service date: 2009 • 9 miles 115kV underground • Projected in-service date: 2008 Long Island Cable 138 kV cross sound $72 Million (CL&P 50% Share) • 13 miles 138kV submarine cable • Joint project with LIPA • Projected in-service date: 2007 *Costs are being reevaluated
Financial Implications For customers: • Improved reliability – creates secure supply, quality service and stable environment for production and growth • Lower levels of congestion and less LICAP exposure results in lower bills • Increased access by competitive generators should lower costs For shareholders: • Increases in rate base from investments drive earnings growth (compound annual growth rate greater than 20%) • $500 million of current rate base • $1 billion - $1.5 billion of capital spending projected in 2005-2009 • Siting for our large projects is progressing • Our cost recovery mechanisms are largely defined
Transmission Capital Expenditures* NU’s Transmission growth has already begun. $ Millions * Spending levels depend on final level and timing of all projects.
We Believe that a Significant, Continuing Stream of Investments in Transmission is Sustainable • Line rebuilds to replace aging, low capacity conductor • Voltage conversions from 69 kV to 115 kV • Additional 345 – 115 kV autotransformers • New 115 and 345 kV lines (overhead and underground) to meet load growth and to increase transfer capability across constrained interfaces • New substations to meet load growth